


最近三天,看了机器学习实战这本书的决策树一张,打算根据自己的理解对一章的代码进行说明一下,顺便做一下笔记,方便以后的查找。
关于决策树,我有一篇是单独讲的(在这一篇,为了说明问题,可能会有一些重复的地方),只是没有代码的实现。在这里用代码进行实现(python来自机器学习实践这本书),并对代码进行讲解。
1、首先,我们要知道信息增益的概念(后面要用到),信息增益是经验熵和经验条件熵之差,这里有引出了经验熵和经验条件熵的概念,要想知道这些概念我们还要首先知道什么是熵。
btw:说一下熵这个东西,这个东西是香农提出来的,又叫香农熵,如果不知道香农,这里有一段话是说他的:贝尔实验室和MIT的很多人将香农和爱因斯坦相提并论,而其他人则认为这种对比是不公平的-------对香农是不公平的。有兴趣的可以查查这个人。
第一部分:
下面说正题,什么是熵??
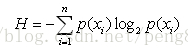
熵定义为信息的期望值。符号xi信息的定义公式为:

其中p(xi)是选择分类的概率
熵就是计算所有类别所有可能值包含的信息期望值,公式如下:
如果说不想看这个公式或者说这个公式很抽象,我们举个例子。

我们上表中的信息用函数实现:
#定义简单鉴定的数据集函数
def createDataSet():
    dataSet = [[1,1,'yes'],
	   [1,1,'yes'],
	   [1,0,'no'],
	   [0,1,'no'],
	   [0,1,'no']]
    labels = ['no surfacing','flippers']
return dataSet, labels# -*- coding: cp936 -*-
#计算给定数据集的香农熵,熵定义为信息的期望值,它代表随即变量的不确定性
from math import log
import operator
def calcShannonEnt(dataSet):
numEntries = len(dataSet)
labelCounts = {}
for featVec in dataSet:
currentLabel = featVec[-1]
if currentLabel not in labelCounts.keys():
labelCounts[currentLabel] = 0
labelCounts[currentLabel] += 1 #这样也可以,书上没有错行
#else:
# labelCounts[currentLabel] += 1#书上错了,因为他没有这句话
shannonEnt = 0.0
for key in labelCounts:
#print(key)
#print(labelCounts[key])
prob = float(labelCounts[key])/numEntries
#print(prob)
shannonEnt -= prob * log(prob,2)#首先计算熵,它的作用是要用它计算每个特征的信息增益
return shannonEnt #熵越高混合的数据也越多将上面两个函数写到一个tree.py文件中。对代码进行执行。得到的结果如下:
>>> import tree
>>> myDat,labels=tree.createDataSet()
>>> myDat
[[1, 1, 'yes'], [1, 1, 'yes'], [1, 0, 'no'], [0, 1, 'no'], [0, 1, 'no']]
>>> tree.calcShannonEnt(myDat)
0.9709505944546686
>>> btw:我们这里用的是最后一列的数据,也就是类别。代码中也可以看出来。这里注意一下
下面我们用一个函数来划分数据集:
这个函数的作用:我们需要计算每个特征划分数据集的结果计算一次信息熵,然后判断按照哪个特征划分数据集是做好的划分方式。(也就是信息增益大的那个数据集)
上面我们说了:信息增益是经验熵和经验条件熵之差,这个的划分数据集就是为了计算经验条件熵,如果还是不懂,就看代码,看完代码之后看我那篇讲决策树的例子,上面有例子。相结合就看明白了,我就是这么看明白的。
代码如下:
#得到熵之后,我们就可以按照获取最大信息增益的方法划分数据集,
#那么如何划分数据集以及如何度量信息增益
'''
现在这说一个append和extend的区别
>>> a = [1,2,3]
>>> b = [4,5,6]
>>> a.append(b)
>>> a
[1, 2, 3, [4, 5, 6]]
>>> a = [1,2,3]
>>> a.extend(b)
>>> a
[1, 2, 3, 4, 5, 6]
'''
def splitDataSet(dataSet, axis, value):
    retDataSet = []
    for featVec in dataSet:
        if featVec[axis] == value:
            reducedFeatVec = featVec[:axis]
            reducedFeatVec.extend(featVec[axis+1:])
            retDataSet.append(reducedFeatVec)
    #print(retDataSet)
    return retDataSet
我们对上面的函数进行测试一下:
>>> tree.splitDataSet(myDat,0,1) #这里的意思是特征0中为1的数据集,也就是可以浮出水面可以生存的海洋生物(看上表)
[[1, 'yes'], [1, 'yes'], [0, 'no']]
>>> tree.splitDataSet(myDat,0,0)#这里的意思是特征0中为0的数据集,也就是不可以浮出水面可以生存的海洋生物(看上表)
[[1, 'no'], [1, 'no']]
下面我们的函数为选择最好的数据集划分方式的特征,也就是信息增益最大的特征。函数代码:
#选取特征,划分数据集,计算得出最好的划分数据集的特征
def chooseBestFeatureToSplit(dataSet):
    numFeatures = len(dataSet[0]) - 1  #剩下的是特征的个数
    baseEntropy = calcShannonEnt(dataSet)#计算数据集的熵,放到baseEntropy中
    bestInfoGain = 0.0;bestFeature = -1
    for i in range(numFeatures):
        featList = [example[i] for example in dataSet]
        uniqueVals = set(featList)
        newEntropy = 0.0
        for value in uniqueVals:#下面是计算每种划分方式的信息熵,特征i个,每个特征value个值
            subDataSet = splitDataSet(dataSet, i ,value)
            prob = len(subDataSet)/float(len(dataSet))
            newEntropy = prob * calcShannonEnt(subDataSet)
        infoGain = baseEntropy - newEntropy  #计算i个特征的信息熵
        #print(infoGain)
        if(infoGain > bestInfoGain):
            bestInfoGain = infoGain
            bestFeature = i
    return bestFeature
测试如上代码:
>>> myDat,labels=tree.createDataSet()
>>> myDat
[[1, 1, 'yes'], [1, 1, 'yes'], [1, 0, 'no'], [0, 1, 'no'], [0, 1, 'no']]
<pre name="code" class="python">>>> labels
['no surfacing', 'flippers']
>>> tree.chooseBestFeatureToSplit(myDat)
0.419973094022
0.170950594455
0
>>>
#返回出现次数最多的分类名称
def majorityCnt(classList):
    classCount = {}
    for vote in classList:
        if vote not in classCount.keys():classCount[vote] = 0
        classCount[vote] += 1
    sortedClassCount  = sorted(classCount.iteritems(),\
                             key=operator.itemgetter(1), reverse=True)
    return sortedClassCount[0][0]
>>> reload(tree)
<module 'tree' from 'C:\Python27\tree.py'>
>>> tree.majorityCnt(classList)
'no'创建树的代码:def createTree(dataSet,labels):
classList = [example[-1] for example in dataSet]#将最后一行的数据放到classList中
if classList.count(classList[0]) == len(classList):
return classList[0]
if len(dataSet[0]) == 1:#这里为什么是1呢?就是说特征数为1的时候
return majorityCnt(classList)#就返回这个特征就行了,因为就这一个特征
bestFeat = chooseBestFeatureToSplit(dataSet)
print(bestFeat)
bestFeatLabel = labels[bestFeat]#运行结果'no surfacing'
myTree = {bestFeatLabel:{}}#运行结果{'no surfacing': {}}
del(labels[bestFeat])
featValues = [example[bestFeat] for example in dataSet]#第0个特征值
uniqueVals = set(featValues)
for value in uniqueVals:
subLabels = labels[:]
myTree[bestFeatLabel][value] = createTree(splitDataSet\
(dataSet,bestFeat,value),subLabels)
return myTree>>> reload(tree)
<module 'tree' from 'C:\Python27\tree.pyc'>
>>> myDat,labels = tree.createDataSet()
>>> myTree = tree.createTree(myDat,labels)
0.419973094022 #下面输出的是特征的信息增益,如果不想输出,把createTree里面的print(bestFeat)注释掉就OK了
0.170950594455
0
0.918295834054
0
>>> myTree
{'no surfacing': {0: 'no', 1: {'flippers': {0: 'no', 1: 'yes'}}}}
这就是我们要的树。#在这里我们新定义一个文件,叫treePlotter.py来实现这个功能。#先定义两个函数,来实现获取叶结点的数目<strong>和</strong>树的层数的函数#得到叶子节点的数目
def getNumLeafs(myTree):
numLeafs = 0
firstStr = myTree.keys()[0]
secondDict = myTree[firstStr]
for key in secondDict.keys():
if type(secondDict[key]).__name__=='dict':#这里说的只是二叉树吧??应该?
numLeafs +=getNumLeafs(secondDict[key])
else:
numLeafs += 1
return numLeafs
#树的层数
def getTreeDepth(myTree):
maxDepth = 0
firstStr = myTree.keys()[0]
secondDict = myTree[firstStr]
for key in secondDict.keys():
if type(secondDict[key]).__name__ == 'dict':#一层只有一个dict
thisDepth = 1 + getTreeDepth(secondDict[key])
#print(123)
else:
thisDepth = 1
#print(456)
if thisDepth > maxDepth: maxDepth = thisDepth
return maxDepth#函数retrieveTree输出预先存储的树信息
#避免每次测试代码时都要从数据中创建树的麻烦
def retrieveTree(i):
listOfTrees = [{'no surfacing':{0:'no',1:{'flippers':\
{0:'no',1:'yes'}}}},
{'no surfacing':{0:'no',1:{'flippers':\
{0:{'head':{0:'no',1:'yes'}},1:'no'}}}}
]
return listOfTrees[i]下面要实现的就是画树的函数了。下面的代码没有看懂。<pre name="code" class="python"># -*- coding: cp936 -*-
import matplotlib.pyplot as plt
decisionNode = dict(boxstyle = "sawtooth",fc="0.8")
leafNode = dict(boxstyle="round4",fc="0.8")
arrow_args = dict(arrowstyle="<-")
def plotNode(nodeTxt,centerPt,parentPt,nodeType):
createPlot.ax1.annotate(nodeTxt,xy=parentPt,xycoords = 'axes fraction',
xytext=centerPt,textcoords='axes fraction',va="center",ha="center",bbox=nodeType,arrowprops=arrow_args)
'''
def createPlot():
fig = plt.figure(1, facecolor='white')#创建一个新图形
fig.clf()#清空绘图区
createPlot.axl = plt.subplot(111,frameon=False)
#在图中绘制两个代表不同类型的树节点
plotNode('a decision node',(0.5,0.1),(0.1,0.5),decisionNode)
plotNode('a leaf node',(0.8,0.1),(0.3,0.8),leafNode)
plt.show()
'''
#画二叉树,实现和上面代码相似的功能
#1、计算父节点和子节点的中间位置
def plotMidText(cntrPt, parentPt, txtString):
xMid = (parentPt[0]-cntrPt[0])/2.0 + cntrPt[0]
yMid = (parentPt[1]-cntrPt[1])/2.0 + cntrPt[1]
createPlot.ax1.text(xMid,yMid,txtString)#??
#绘制树的很多工作都是在这个函数中完成
def plotTree(myTree,parentPt,nodeTxt):
#计算树的宽和高
numLeafs = getNumLeafs(myTree)
depth = getTreeDepth(myTree)
firstStr = myTree.keys()[0]
cntrPt = (plotTree.xOff + (1.0 + float(numLeafs))/2.0/plotTree.totalW,\
plotTree.yOff)#??
plotMidText(cntrPt,parentPt,nodeTxt)
plotNode(firstStr, cntrPt, parentPt, decisionNode)
secondDict = myTree[firstStr]
plotTree.yOff = plotTree.yOff - 1.0/plotTree.totalD
for key in secondDict.keys():
if type(secondDict[key]).__name__ == 'dict':
plotTree(secondDict[key],cntrPt,str(key))
else:
plotTree.xOff = plotTree.xOff + 1.0/plotTree.totalW
plotNode(secondDict[key], (plotTree.xOff,plotTree.yOff), cntrPt, leafNode)
plotMidText((plotTree.xOff,plotTree.yOff),cntrPt,str(key))
plotTree.yOff = plotTree.yOff + 1.0/plotTree.totalD
def createPlot(inTree):
fig = plt.figure(1, facecolor='white')
fig.clf()
axprops = dict(xticks=[],yticks=[])
createPlot.ax1 = plt.subplot(111,frameon=False, **axprops)
plotTree.totalW = float(getNumLeafs(inTree))
plotTree.totalD = float(getTreeDepth(inTree))
plotTree.xOff = -0.5/plotTree.totalW;plotTree.yOff = 1.0;
print(plotTree.xOff,plotTree.yOff)
#plotTree.xOff = 1.0;plotTree.yOff = 1.0;
plotTree(inTree, (0.5,1.0), '')
plt.show()对treePlotter.py中的函数进行测试
>>> import treePlotter
>>>
>>> myTree=treePlotter.retrieveTree(0)
>>> treePlotter.createPlot(myTree)
(-0.16666666666666666, 1.0)
第三部分:既然树有了(第一部分得到的,那么我们怎么用他来测试呢?)
定义一个使用决策树的分类函数
#下面代码我们将在真实的数据上使用决策树分类算法,验证它是否可以正确预测出患者应该使用的隐形眼镜类型
#使用决策树的分类函数
def classify(inputTree,featLabels,testVec):
    firstStr = inputTree.keys()[0]
    secondDict = inputTree[firstStr]
    featIndex = featLabels.index(firstStr)#firstStr的索引
    for key in secondDict.keys():
        if testVec[featIndex] == key:
            if type(secondDict[key]).__name__ == 'dict':
                classLabel = classify(secondDict[key],featLabels,testVec)
            else:
                classLabel = secondDict[key]
    return classLabel
对上面代码的测试:
>>> import tree
>>> myDat,labels=tree.createDataSet()
>>> labels
['no surfacing', 'flippers']
>>> myTree
{'no surfacing': {0: 'no', 1: {'flippers': {0: 'no', 1: 'yes'}}}}
>>> tree.classify(myTree,labels,[1,0])#测试能浮出水面,但是没有脚蹼的生物是不是鱼类,结果是no
'no'
>>> tree.classify(myTree,labels,[1,1])#测试能浮出水面,但是有脚蹼的生物是不是鱼类,结果是yes
'yes'


 323
323


 被折叠的 条评论
为什么被折叠?
被折叠的 条评论
为什么被折叠?
 到【灌水乐园】发言


