


本篇汇总了Matlab中常用的命令,包括:会话管理,系统命令,输入输出,矩阵运算,绘图等,并在后面附上实例说明。
--------------------------------常用命令语句----------------------------
管理会话的命令
| 命令 | 目的/作用 |
|---|---|
| clc | 清除命令窗口。 |
| clear | 从内存中删除变量。 |
| exist | 检查存在的文件或变量。 |
| global | 声明变量为全局。 |
| help | 搜索帮助主题。 |
| lookfor | 搜索帮助关键字条目。 |
| quit | 停止MATLAB。 |
| who | 列出当前变量。 |
| whos | 列出当前变量(长显示)。 |
1.clear :清除内存变量和函数,把WorkSpace的变量清空;
2.clc :清除当前Matlab命令窗口的内容,注意clc不清楚变量。一般在编写m文件的时候,不是函数的话,前面一般都要加上clear;clc; 目的就是在m文件运行的时候,把内存和屏幕都清空,以免同名称的变量影响以及屏幕容易观察;
3.help :这也是最重要的一个函数吧。在想要知道某个函数的相关说明的时候,可以使用help 函数名来获取,当然也可以使用“doc ..”打开帮助文档。
使用系统命令:
| 命令 | 目的/作用 |
|---|---|
| cd | 改变当前目录。 |
| date | 显示当前日期。 |
| delete | 删除一个文件。 |
| pwd | 显示当前目录。 |
| save | 保存在一个文件中的工作区变量。 |
| lookfor | 搜索帮助关键字条目。 |
| quit | 停止MATLAB。 |
| who | 列出当前变量。 |
| whos | 列出当前变量(长显示)。 |
输入和输出命令
| 命令 | 作用/目的 |
|---|---|
| disp | 显示一个数组或字符串的内容。 |
| fscanf | 阅读从文件格式的数据。 |
| format | 控制屏幕显示的格式。 |
| fprintf | 执行格式化写入到屏幕或文件。 |
向量,矩阵和阵列命令:
| 命令 | 作用/目的 |
|---|---|
| cat | Concatenates arrays. |
| find | Finds indices of nonzero elements. |
| length | Computes number of elements. |
| linspace | Creates regularly spaced vector. |
| logspace | Creates logarithmically spaced vector. |
| max | Returns largest element. |
| min | Returns smallest element. |
| prod | Product of each column. |
| reshape | Changes size. |
| size | Computes array size. |
| sort | Sorts each column. |
| sum | Sums each column. |
| eye | Creates an identity matrix. |
| ones | Creates an array of ones. |
| zeros | Creates an array of zeros. |
| num2cell | Converts numeric array to cell array. |
绘图命令:
| 命令 | 作用/目的 |
|---|---|
| axis | Sets axis limits. |
| grid | Displays gridlines. |
| plot | Generates xy plot. |
| title | Puts text at top of plot. |
| xlabel | Adds text label to x-axis. |
| ylabel | Adds text label to y-axis. |
| close | Closes the current plot. |
| close all | Closes all plots. |
| figure | Opens a new figure window. |
| subplot | Creates plots in subwindows. |
--------------------------实例说明部分-------------------------
矩阵基本知识:
>> a=rand(2,3) %随机生成2*3的矩阵

a =

    0.2785    0.9575    0.1576
    0.5469    0.9649    0.9706
>> a(2,3) %显示第2行第3列的矩阵元素
ans =
0.9706
>> a(1,1)%显示第1行第1列的矩阵元素
ans =
0.2785>> a(1,:) %显示第一行矩阵元素
ans =
0.2785 0.9575 0.1576
>> a(2,:) %显示第2行矩阵元素
ans =
0.5469 0.9649 0.9706>> a(:) %将矩阵转化为一维列矩阵
ans =
0.2785
0.5469
0.9575
0.9649
0.1576
0.9706>> a=[a,[1;2]] %新增加一列元素
a =
0.2785 0.9575 0.1576 1.0000
0.5469 0.9649 0.9706 2.0000>> a=rand(2,3) %随机生成2*3矩阵
a =
0.9572 0.8003 0.4218
0.4854 0.1419 0.9157
>> b=rand(3,3) %随机生成3*3矩阵
b =
0.7922 0.0357 0.6787
0.9595 0.8491 0.7577
0.6557 0.9340 0.7431
>> c=[a',b] %用“,”连接2个有相同行数的矩阵
c =
0.9572 0.4854 0.7922 0.0357 0.6787
0.8003 0.1419 0.9595 0.8491 0.7577
0.4218 0.9157 0.6557 0.9340 0.7431
>> d=[a;b] %用“;”连接2个有相同列数的矩阵
d =
0.9572 0.8003 0.4218
0.4854 0.1419 0.9157
0.7922 0.0357 0.6787
0.9595 0.8491 0.7577
0.6557 0.9340 0.7431MATLAB冒号的作用:
| 格式 | 目的 |
|---|---|
| A(:,j) | is the jth column of A. |
| A(i,:) | is the ith row of A. |
| A(:,:) | is the equivalent two-dimensional array. For matrices this is the same as A. |
| A(j:k) | is A(j), A(j+1),...,A(k). |
| A(:,j:k) | is A(:,j), A(:,j+1),...,A(:,k). |
| A(:,:,k) | is the kth page of three-dimensional array A. |
| A(i,j,k,:) | is a vector in four-dimensional array A. The vector includes A(i,j,k,1), A(i,j,k,2), A(i,j,k,3), and so on. |
| A(:) | is all the elements of A, regarded as a single column. On the left side of an assignment statement, A(:) fills A, preserving its shape from before. In this case, the right side must contain the same number of elements as A. |
>> A = [1 2 3 4; 4 5 6 7; 7 8 9 10]

A =

     1     2     3     4
     4     5     6     7
     7     8     9    10

>> A(:,2)  %显示第2列

ans =

     2
     5
     8

>> A(1,:) %显示第1行


ans =

     1     2     3     4

>> A(1:2,:)  %显示第1和第2行

ans =

     1     2     3     4
     4     5     6     7

>> A(:,1:2)  %显示第1和第2列

ans =

     1     2
     4     5
     7     8
矩阵运算知识:
>> a = [ 1 2 3 ; 4 5 6; 7 8 9]

a =

     1     2     3
     4     5     6
     7     8     9

>> b = [2 3 4 ; 6 7 8; 8 9 10]

b =

     2     3     4
     6     7     8
     8     9    10

>> a+b

ans =

     3     5     7
    10    12    14
    15    17    19

>> a-b

ans =

    -1    -1    -1
    -2    -2    -2
    -1    -1    -1
>> a=[1,2,3;2 -2 0;3,-3,4]

a =

     1     2     3
     2    -2     0
     3    -3     4

>> find(a>0)

ans =

     1
     2
     3
     4
     7
9>> c=[a,b]
c =
1 2 3 2 3 4
4 5 6 6 7 8
7 8 9 8 9 10
>> d=[a;b]
d =
1 2 3
4 5 6
7 8 9
2 3 4
6 7 8
8 9 10>> e=a*b
e =
38 44 50
86 101 116
134 158 182
>> f=a.*b
f =
2 6 12
24 35 48
56 72 90AA−1 = A−1A = 1>> a = [ 1 2 3; 2 3 4; 1 2 5]
a =
1 2 3
2 3 4
1 2 5
>> inv(a)
ans =
-3.5000 2.0000 0.5000
3.0000 -1.0000 -1.0000
-0.5000 0 0.5000MATLAB 的for,while循环:
在MATLAB中的 for循环的语法是:for index = values
<program statements>
...
endfor a = 10:20
fprintf('value of a: %d \n', a);
endvalue of a: 10
value of a: 11
value of a: 12
value of a: 13
value of a: 14
value of a: 15
value of a: 16
value of a: 17
value of a: 18
value of a: 19
value of a: 20 while <expression>
<statements>
endclear;clc; %%实例,跟for循环输出相同的结果
a = 10;
while( a < 20 )
fprintf('value of a: %d \n', a);
a = a + 1;
endMATLAB绘图:
clear all;clc;
x = [0:5:100];
y = x;
plot(x, y)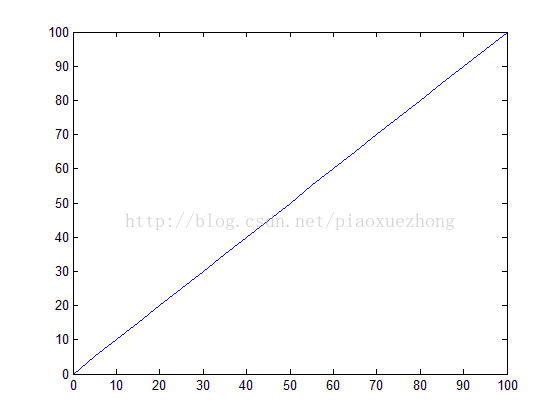
实例2:坐标轴,标识等
clear all;clc;
x = [0:0.01:10];
y = sin(x);
g = cos(x);
plot(x, y, x, g, '.-'), legend('Sin(x)', 'Cos(x)')
hold on
plot(x, y), xlabel('x'), ylabel('Sin(x)'), title('Sin(x) Graph'),
grid on, axis equal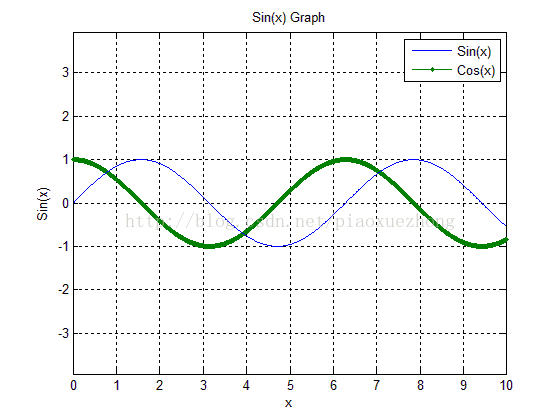
实例3:subplot 命令创建子图:subplot(m, n, p),
clear all;clc;
x = [0:0.01:5];
y = exp(-1.5*x).*sin(10*x);
subplot(1,2,1)
plot(x,y), xlabel('x'),ylabel('exp(–1.5x)*sin(10x)'),axis([0 5 -1 1])
y = exp(-2*x).*sin(10*x);
subplot(1,2,2)
plot(x,y),xlabel('x'),ylabel('exp(–2x)*sin(10x)'),axis([0 5 -1 1])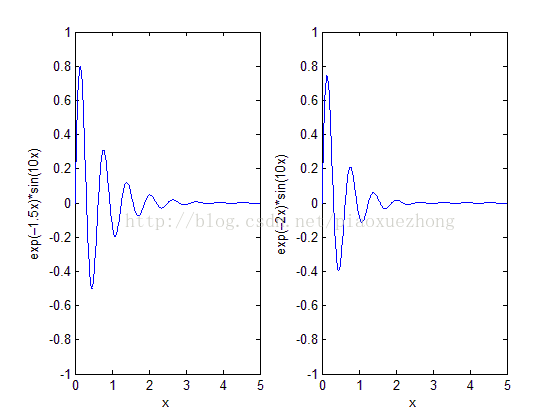
关于3维空间绘图的plot3函数,可以参见:http://blog.csdn.net/piaoxuezhong/article/details/62430051,这里说一下surf函数:
clear all;clc;close all;
[x,y] = meshgrid(-2:.2:2);
g = exp(-x.^2 - y.^2);
surf(x, y, g)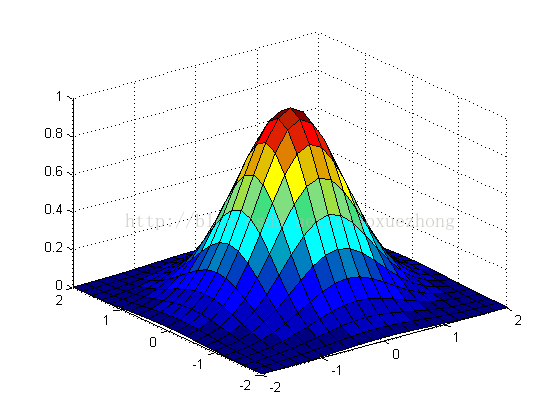
meshgrid 函数用来生成网格矩阵,可以是二维网格矩阵,也可以是三维。对于生成二维网格,用法为:[x y]=meshgrid(a b); % a 和b是一维数组,如a=[1 2 3]; b= [2 3 4 ]; 则生成的 x 和 y 都是二维的矩阵,x 的每行都是 1 2 3,共三行,y 每列都是2 3 4,共三列。
参考:
http://www.yiibai.com/matlab/matlab_for_loop.html
http://www.cnblogs.com/asxinyu/p/Basic_Matlab_Experience.html#_label1
http://www.doc88.com/p-5035471961489.html
http://blog.csdn.net/abcjennifer/article/details/7706581


 934
934

 被折叠的 条评论
为什么被折叠?
被折叠的 条评论
为什么被折叠?
 到【灌水乐园】发言


