


MATLAB bar图 在条形末端指定标签
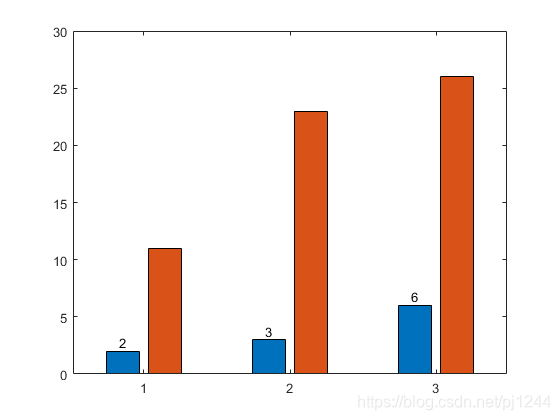
将 vals 定义为一个包含两个数据集的值的矩阵。在条形图中显示值,并指定输出参数。由于有两个数据集,bar 返回包含两个 Bar 对象的向量。
// An highlighted block
x = [1 2 3];
vals = [2 3 6; 11 23 26];
b = bar(x,vals);

在第一个条形序列的末端显示值。通过获取第一个 Bar 对象的 XEndPoints 和 YEndPoints 属性,获取条形末端的坐标。将这些坐标传递给 text 函数,并指定垂直和水平对齐方式,让值显示在条形末端上方居中处。
// An highlighted block
xtips1 = b(1).XEndPoints;
ytips1 = b(1).YEndPoints;
labels1 = string(b(1).YData);
text(xtips1,ytips1,labels1,'HorizontalAlignment','center',...
    'VerticalAlignment','bottom')
接下来,在第二个条形序列的末端上方显示值。
// An highlighted block
xtips2 = b(2).XEndPoints;
ytips2 = b(2).YEndPoints;
labels2 = string(b(2).YData);
text(xtips2,ytips2,labels2,'HorizontalAlignment','center',...
    'VerticalAlignment','bottom')

可在MATLAB中输入
openExample(‘graphics/BarLabelsOnBarsExample’)
有算例


 323
323

 被折叠的 条评论
为什么被折叠?
被折叠的 条评论
为什么被折叠?
 到【灌水乐园】发言


