


介绍
randomForest 使用 Breiman 的随机森林算法(based on Breiman and Cutler’s original Fortran code)实现分类和回归。它也具有无监督模式(unsupervised mode for assessing proximities among data points).
randomForest()的用法
## S3 method for class 'formula'
randomForest(formula, data=NULL, ..., subset, na.action=na.fail)
## Default S3 method:
randomForest(x, y=NULL,  xtest=NULL, ytest=NULL, ntree=500,
             mtry=if (!is.null(y) && !is.factor(y))
             max(floor(ncol(x)/3), 1) else floor(sqrt(ncol(x))),
             replace=TRUE, classwt=NULL, cutoff, strata,
             sampsize = if (replace) nrow(x) else ceiling(.632*nrow(x)),
             nodesize = if (!is.null(y) && !is.factor(y)) 5 else 1,
             maxnodes = NULL,
             importance=FALSE, localImp=FALSE, nPerm=1,
             proximity, oob.prox=proximity,
             norm.votes=TRUE, do.trace=FALSE,
             keep.forest=!is.null(y) && is.null(xtest), corr.bias=FALSE,
             keep.inbag=FALSE, ...)
## S3 method for class 'randomForest'
print(x, ...)
参数介绍
-
data
an optional data frame containing the variables in the model. By default the variables are taken from the environment which randomForest is called from. -
subset
an index vector indicating which rows should be used. (NOTE: If given, this argument must be named.) -
na.action
A function to specify the action to be taken if NAs are found. (NOTE: If given, this argument must be named.) -
x, formula
a data frame or a matrix of predictors, or a formula describing the model to be fitted (for the print method, an randomForest object). -
y
A response vector. If a factor, classification is assumed, otherwise regression is assumed. If omitted, randomForest will run in unsupervised mode. -
xtest
a data frame or matrix (like x) containing predictors for the test set. -
ytest
response for the test set. -
ntree
Number of trees to grow. This should not be set to too small a number, to ensure that every input row gets predicted at least a few times. -
mtry
Number of variables randomly sampled as candidates at each split. Note that the default values are different for classification (sqrt§ where p is number of variables in x) and regression (p/3) -
replace
Should sampling of cases be done with or without replacement? -
classwt
Priors of the classes. Need not add up to one. Ignored for regression. -
cutoff
(Classification only) A vector of length equal to number of classes. The ‘winning’ class for an observation is the one with the maximum ratio of proportion of votes to cutoff. Default is 1/k where k is the number of classes (i.e., majority vote wins). -
strata
A (factor) variable that is used for stratified sampling. -
sampsize
Size(s) of sample to draw. For classification, if sampsize is a vector of the length the number of strata, then sampling is stratified by strata, and the elements of sampsize indicate the numbers to be drawn from the strata. -
nodesize
Minimum size of terminal nodes. Setting this number larger causes smaller trees to be grown (and thus take less time). Note that the default values are different for classification (1) and regression (5). -
maxnodes
Maximum number of terminal nodes trees in the forest can have. If not given, trees are grown to the maximum possible (subject to limits by nodesize). If set larger than maximum possible, a warning is issued. -
importance
Should importance of predictors be assessed? -
localImp
Should casewise importance measure be computed? (Setting this to TRUE will override importance.) -
nPerm
Number of times the OOB data are permuted per tree for assessing variable importance. Number larger than 1 gives slightly more stable estimate, but not very effective. Currently only implemented for regression. -
proximity
Should proximity measure among the rows be calculated? -
oob.prox
Should proximity be calculated only on “out-of-bag” data? -
norm.votes
If TRUE (default), the final result of votes are expressed as fractions. If FALSE, raw vote counts are returned (useful for combining results from different runs). Ignored for regression. -
do.trace
If set to TRUE, give a more verbose output as randomForest is run. If set to some integer, then running output is printed for every do.trace trees. -
keep.forest
If set to FALSE, the forest will not be retained in the output object. If xtest is given, defaults to FALSE. -
corr.bias
perform bias correction for regression? Note: Experimental. Use at your own risk. -
keep.inbag
Should an n by ntree matrix be returned that keeps track of which samples are “in-bag” in which trees (but not how many times, if sampling with replacement) -
…
optional parameters to be passed to the low level function randomForest.default.
输出参数
-
call
the original call to randomForest -
type
one of regression, classification, or unsupervised. -
predicted
the predicted values of the input data based on out-of-bag samples. -
importance
a matrix with nclass + 2 (for classification) or two (for regression) columns. For classification, the first nclass columns are the class-specific measures computed as mean descrease in accuracy. The nclass + 1st column is the mean descrease in accuracy over all classes. The last column is the mean decrease in Gini index. For Regression, the first column is the mean decrease in accuracy and the second the mean decrease in MSE. If importance=FALSE, the last measure is still returned as a vector. -
importanceSD
The “standard errors” of the permutation-based importance measure. For classification, a p by nclass + 1 matrix corresponding to the first nclass + 1 columns of the importance matrix. For regression, a length p vector. -
localImp
a p by n matrix containing the casewise importance measures, the [i,j] element of which is the importance of i-th variable on the j-th case. NULL if localImp=FALSE. -
ntree
number of trees grown. -
mtry
number of predictors sampled for spliting at each node. -
forest
(a list that contains the entire forest; NULL if randomForest is run in unsupervised mode or if keep.forest=FALSE. -
err.rate
(classification only) vector error rates of the prediction on the input data, the i-th element being the (OOB) error rate for all trees up to the i-th. -
confusion
(classification only) the confusion matrix of the prediction (based on OOB data). -
votes
(classification only) a matrix with one row for each input data point and one column for each class, giving the fraction or number of (OOB) ‘votes’ from the random forest. -
oob.times
number of times cases are ‘out-of-bag’ (and thus used in computing OOB error estimate) -
proximity
if proximity=TRUE when randomForest is called, a matrix of proximity measures among the input (based on the frequency that pairs of data points are in the same terminal nodes). -
mse
(regression only) vector of mean square errors: sum of squared residuals divided by n. -
rsq
(regression only) “pseudo R-squared”: 1 - mse / Var(y). -
test
if test set is given (through the xtest or additionally ytest arguments), this component is a list which contains the corresponding predicted, err.rate, confusion, votes (for classification) or predicted, mse and rsq (for regression) for the test set. If proximity=TRUE, there is also a component, proximity, which contains the proximity among the test set as well as proximity between test and training data.
实例
## Classification:
data(iris)
set.seed(71)
iris.rf <- randomForest(Species ~ ., data=iris,ntree=48,replace=TRUE,maxnodes=20, importance=TRUE,
                        proximity=TRUE)
print(iris.rf)
# Call:
#   randomForest(formula = Species ~ ., data = iris, ntree = 48,      replace = TRUE, maxnodes = 20, importance = TRUE, proximity = TRUE)
# Type of random forest: classification
# Number of trees: 48
# No. of variables tried at each split: 2
#
# OOB estimate of  error rate: 4.67%
# Confusion matrix:
#   setosa versicolor virginica class.error
# setosa         50          0         0        0.00
# versicolor      0         47         3        0.06
# virginica       0          4        46        0.08

## Look at variable importance:
round(importance(iris.rf), 2)
# setosa versicolor virginica MeanDecreaseAccuracy MeanDecreaseGini
# Sepal.Length   1.63       2.16      2.91                 4.02             9.40
# Sepal.Width    1.01       0.70      2.77                 1.82             1.92
# Petal.Length   7.32      11.24     10.11                11.83            45.69
# Petal.Width    6.67       8.72      9.09                 9.61            42.41

iris.rf$type
#[1] "classification"
iris.rf$importance
# setosa  versicolor  virginica MeanDecreaseAccuracy
# Sepal.Length 0.023248570 0.025510544 0.04829372           0.03142518
# Sepal.Width  0.001388889 0.007642997 0.01470402           0.00725067
# Petal.Length 0.364070312 0.355775970 0.33621798           0.34793819
# Petal.Width  0.341254891 0.310539307 0.27368659           0.30499327
# MeanDecreaseGini
# Sepal.Length         9.402859
# Sepal.Width          1.919722
# Petal.Length        45.693909
# Petal.Width         42.411844
#

iris.rf$ntree
# [1] 48

iris.rf$mtry
# [1] 2
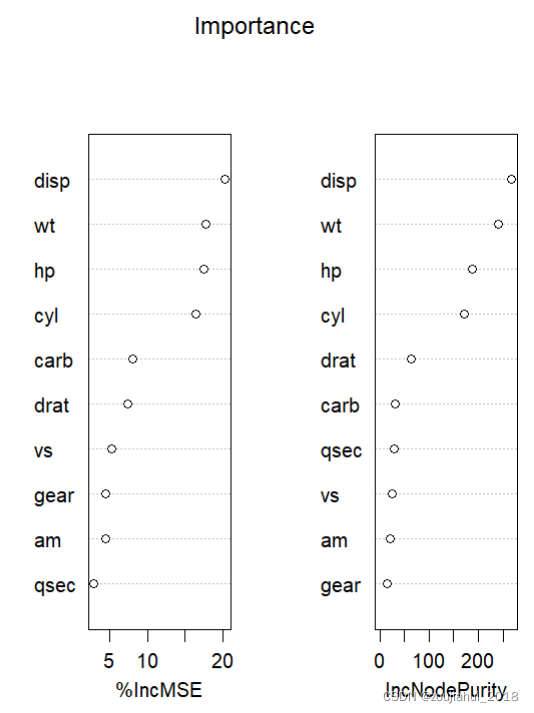
varImpPlot()的用法
varImpPlot()用于对变量重要性绘制散点图
varImpPlot(x, sort=TRUE, n.var=min(30, nrow(x$importance)),
           type=NULL, class=NULL, scale=TRUE,
           main=deparse(substitute(x)), ...)
参数介绍
-
x
An object of class randomForest. -
sort
Should the variables be sorted in decreasing order of importance? -
n.var
How many variables to show? (Ignored if sort=FALSE.) -
type, class, scale
arguments to be passed on to importance -
main
plot title. -
…
Other graphical parameters to be passed on to dotchart
实例
set.seed(4543)
data(mtcars)
mtcars.rf <- randomForest(mpg ~ ., data=mtcars, ntree=1000, keep.forest=FALSE,
                          importance=TRUE)
varImpPlot(mtcars.rf,sort=TRUE,main = 'Importance')


 2128
2128


 被折叠的 条评论
为什么被折叠?
被折叠的 条评论
为什么被折叠?
 到【灌水乐园】发言


