


 本文详细介绍了R语言中stats包中的hclust()函数,包括其参数d的使用、agglomeration方法的选择,以及plot()函数的图形展示。通过美国暴力犯罪率数据实例,演示了如何运用hclust进行层次聚类,并展示了如何调整标签位置和绘制不同风格的聚类树。
介绍
hclust()函数是stats包中的函数,可以根据距离矩阵实现层次聚类。
hclust()使用介绍
hclust(d, method = "complete", members = NULL)
## S3 method for class 'hclust'
plot(x, labels = NULL, hang = 0.1, check = TRUE,
     axes = TRUE, frame.plot = FALSE, ann = TRUE,
     main = "Cluster Dendrogram",
     sub = NULL, xlab = NULL, ylab = "Height", ...)
参数介绍
-
d
a dissimilarity structure as produced by dist. -
method
the agglomeration method to be used. This should be (an unambiguous abbreviation of) one of “ward.D”, “ward.D2”, “single”, “complete”, “average” (= UPGMA), “mcquitty” (= WPGMA), “median” (= WPGMC) or “centroid” (= UPGMC). -
members
NULL or a vector with length size of d. See the ‘Details’ section. -
x
an object of the type produced by hclust. -
hang
The fraction of the plot height by which labels should hang below the rest of the plot. A negative value will cause the labels to hang down from 0. -
check
logical indicating if the x object should be checked for validity. This check is not necessary when x is known to be valid such as when it is the direct result of hclust(). The default is check=TRUE, as invalid inputs may crash R due to memory violation in the internal C plotting code. -
labels
A character vector of labels for the leaves of the tree. By default the row names or row numbers of the original data are used. If labels = FALSE no labels at all are plotted. -
axes, frame.plot, ann
logical flags as in plot.default. -
main, sub, xlab, ylab
character strings for title. sub and xlab have a non-NULL default when there’s a tree$call. -
…
Further graphical arguments. E.g., cex controls the size of the labels (if plotted) in the same way as text.
输出值
An object of class hclust which describes the tree produced by the clustering process. The object is a list with components:
-
merge
an n-1 by 2 matrix. Row i of merge describes the merging of clusters at step i of the clustering. If an element j in the row is negative, then observation -j was merged at this stage. If j is positive then the merge was with the cluster formed at the (earlier) stage j of the algorithm. Thus negative entries in merge indicate agglomerations of singletons, and positive entries indicate agglomerations of non-singletons. -
height
a set of n-1 real values (non-decreasing for ultrametric trees). The clustering height: that is, the value of the criterion associated with the clustering method for the particular agglomeration. -
order
a vector giving the permutation of the original observations suitable for plotting, in the sense that a cluster plot using this ordering and matrix merge will not have crossings of the branches. -
labels
labels for each of the objects being clustered. -
call
the call which produced the result. -
method
the cluster method that has been used. -
dist.method
the distance that has been used to create d (only returned if the distance object has a “method” attribute).
实例
require(graphics)
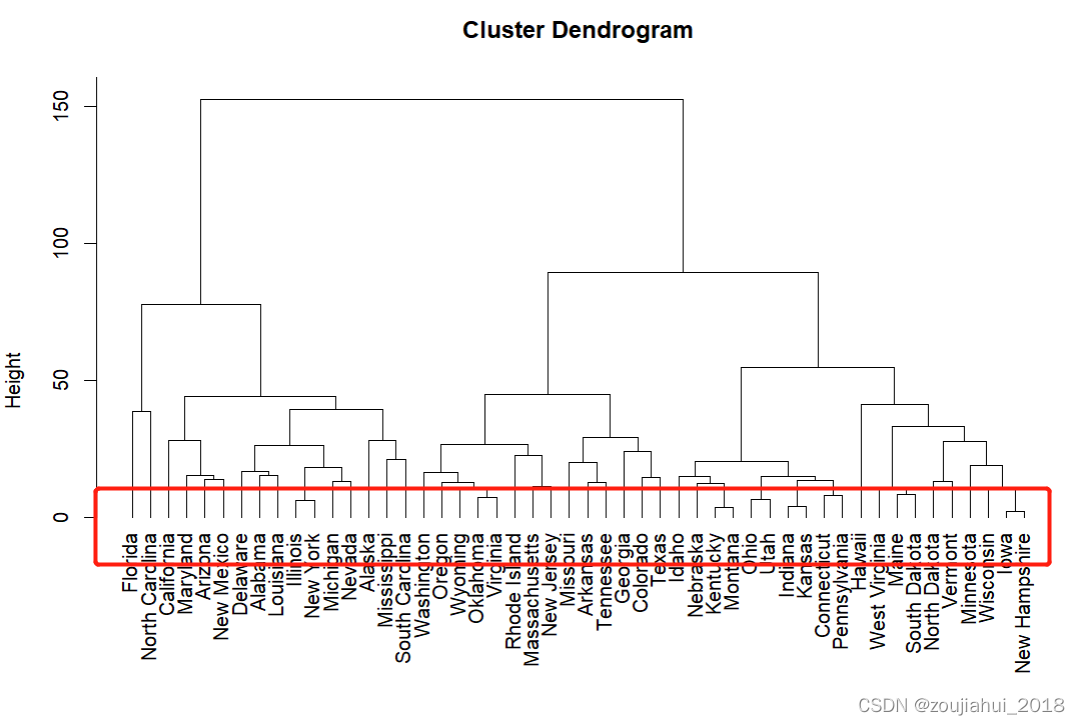
### Example 1: Violent crime rates by US state
hc <- hclust(dist(USArrests), "ave")
plot(hc)

plot(hc, hang = -1)


 306
306

 被折叠的 条评论
为什么被折叠?
被折叠的 条评论
为什么被折叠?
 到【灌水乐园】发言


