


对于给定邻接矩阵,网络节点间联通状态已知的问题,求解最短路径的算法有很多,这里用广度优先搜索来实现,效果还不错。
% 广度优先搜索规则:
% (1) 队列头节点作为当前访问下一个未来访问的邻接点,这个顶点必须是当前顶点的邻接点,标记它,并把它插入到队列中。
% (2) 如果没有未访问顶点而不能执行规则1时,那么从队列头取一个顶点,并使其成为当前顶点。
% (3) 如果因为队列为空而不能执行规则2,则搜索结束。
clc
clear
global loc G flag st ed rec id queue
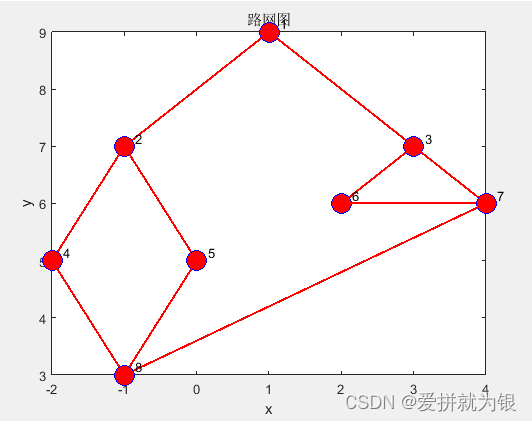
loc=[1 9
-1 7
3 7
-2 5
0 5
2 6
4 6
-1 3];%节点坐标
G=[0 1 1 0 0 0 0 0
1 0 0 1 1 0 0 0
1 0 0 0 0 1 1 0
0 1 0 0 0 0 0 1
0 1 0 0 1 0 0 1
0 0 1 0 0 0 1 0
0 0 1 0 0 1 0 1
0 0 0 1 1 0 1 0];%邻接矩阵
flag=zeros(1,size(G,1));%访问标记
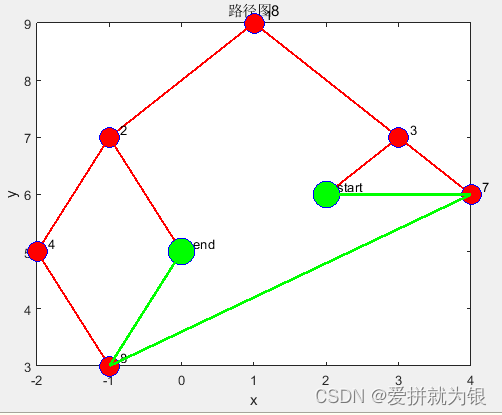
st=6;%开始点
ed=5;%结束点
flag(st)=1;
queue=zeros(1,size(G,1));
rec=[];
id=1;
queue(id)=st;
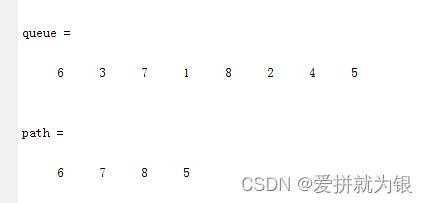
path=bfs();%深度优先搜索
path
figs=1;
figure(figs)
for i=1:size(G,1)
for j=1:size(G,2)
if G(i,j)==1
plot([loc(i,1) loc(j,1)],[loc(i,2) loc(j,2)],'r-','LineWidth',1.5);
hold on
end
end
text(loc(i,1)+0.15,loc(i,2)+0.15,num2str(i));
hold on
plot(loc(i,1),loc(i,2),'o','MarkerSize',15,'MarkerEdgeColor','b','MarkerFaceColor','r');
end
title('路网图')
xlabel('x')
ylabel('y')
figs=figs+1;
draw(figs,i,path);
function [path]=bfs()
global G st ed queue id
pre_list=G.*0;
exist_next=1;
cur_idx=id;
while exist_next
head=queue(cur_idx);
if head==0
break;
end
sel=find(G(head,:)==1);
sel=setdiff(sel,queue);
if ~isempty(sel)
% cur_idx=cur_idx+1;
% else
for j=sel
id=id+1;
queue(id)=j;
pre_list(j,head)=1;
if j==ed
exist_next=0;
break;
end
end
end
cur_idx=cur_idx+1;
end
queue
path=[];
if isempty(find(queue==ed))
return;
end
node=queue(id);
path=[node path];
while node~=st
pre=find(pre_list(node,:)==1);
if isempty(pre) && isempty(find(path==st))
path=[];
return;
end
node=pre;
path=[node path];
end
end
function []=draw(figs,idx,rt)
global loc G
figure(figs)
for i=1:size(G,1)
for j=1:size(G,2)
if G(i,j)==1
plot([loc(i,1) loc(j,1)],[loc(i,2) loc(j,2)],'r-','LineWidth',1.5);
hold on
end
end
if i==rt(1)
text(loc(i,1)+0.15,loc(i,2)+0.15,'start');
hold on
plot(loc(i,1),loc(i,2),'o','MarkerSize',20,'MarkerEdgeColor','b','MarkerFaceColor','g');
hold on
elseif i==rt(end)
text(loc(i,1)+0.15,loc(i,2)+0.15,'end');
hold on
plot(loc(i,1),loc(i,2),'o','MarkerSize',20,'MarkerEdgeColor','b','MarkerFaceColor','g');
hold on
else
text(loc(i,1)+0.15,loc(i,2)+0.15,num2str(i));
hold on
plot(loc(i,1),loc(i,2),'o','MarkerSize',15,'MarkerEdgeColor','b','MarkerFaceColor','r');
hold on
end
end
for j=1:length(rt)-1
plot([loc(rt(j),1) loc(rt(j+1),1)],[loc(rt(j),2) loc(rt(j+1),2)],'g-','LineWidth',2);
hold on
end
title(['路径图',num2str(idx)])
xlabel('x')
ylabel('y')
end
测试用例结果:


 1092
1092


 被折叠的 条评论
为什么被折叠?
被折叠的 条评论
为什么被折叠?
 到【灌水乐园】发言


