


import matplotlib.pyplot as plt
import numpy as np
np.random.seed(19680801)
# 重置rc所有参数,类似初始化
plt.rcdefaults()
figure,ax = plt.subplots()
#创建数据
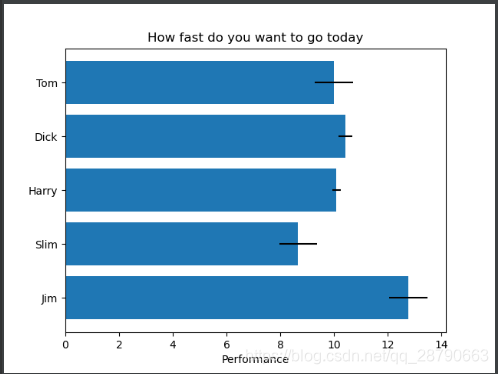
people=["Tom","Dick","Harry","Slim","Jim"]
y_pos = np.arange(len(people))
performance = 3+10*np.random.rand(len(people))
error = np.random.rand(len(people))
print(performance)
#开始画图
ax.barh(y_pos,performance,xerr=error,align='center')
ax.set_yticks(y_pos)
ax.set_yticklabels(people)
ax.invert_yaxis()
ax.set_xlabel('Performance')
ax.set_title("How fast do you want to go today")
plt.show()
这个比较简单


 866
866

 被折叠的 条评论
为什么被折叠?
被折叠的 条评论
为什么被折叠?
 到【灌水乐园】发言


