


目录
一. SpringBoot Actuator 解释
- SpringBoot Actuator是什么: 服务指标监控工具,可以实现对服务内部运行状态的监控,例如Bean的加载情况,环境变量,日志信息,线程信息等

- SpringBoot Actuator 官网
- 使用 SpringBoot Actuator 需要引入依赖,注意点actuator中没有提供web平台,如果需要使用web端进行查询需要引入admin依赖
		<dependency>
            <groupId>org.springframework.boot</groupId>
            <artifactId>spring-boot-starter-actuator</artifactId>
        </dependency>
- 什么是Spring Boot Admin:
- Spring Boot Admin 是一个管理和监控Spring Boot 应用程序的开源软件。每个应用都认为是一个客户端,通过HTTP或者使用 Eureka注册到admin server中进行展示,Spring Boot Admin UI部分使用AngularJs将数据展示在前端。
- Spring Boot Admin 是一个针对spring-boot的actuator接口进行UI美化封装的监控工具。他可以:在列表中浏览所有被监控spring-boot项目的基本信息,详细的Health信息、内存信息、JVM信息、垃圾回收信息、各种配置信息(比如数据源、缓存列表和命中率)等,还可以直接修改logger的level。
<dependencies>
  <dependency>
    <groupId>de.codecentric</groupId>
    <artifactId>spring-boot-admin-server</artifactId>
    <version>1.5.6</version>
  </dependency>
  <dependency>
    <groupId>de.codecentric</groupId>
    <artifactId>spring-boot-admin-server-ui</artifactId>
    <version>1.5.6</version>
  </dependency>
</dependencies>
- SpringBoot中使用actuator与admin以HTTP浏览器端查看服务状态,还需要引入SpringBoot web依赖(actuator可以选择使用 HTTP 端点或 JMX 来管理和监视应用程,先讲解HTTP,需要引入web依赖)
		<dependency>
            <groupId>org.springframework.boot</groupId>
            <artifactId>spring-boot-starter-web</artifactId>
        </dependency>
二. SpringBoot Actuator 基础
- 在使用SpringBoot Actuator时,只要服务中引入actuator依赖,就已经开启了服务监控功能,例如创建SpringBoot服务,引入actorator依赖,服务端口号为8080,此时启动服务,访问"http://localhost:8080/actuator",就可以查看服务暴露的监控端点
{
    "_links":{
        "self":{
            "href":"http://localhost:8080/actuator",
            "templated":false
        },
        "health":{
            "href":"http://localhost:8080/actuator/health",
            "templated":false
        },
        "health-path":{
            "href":"http://localhost:8080/actuator/health/{*path}",
            "templated":true
        },
        "info":{
            "href":"http://localhost:8080/actuator/info",
            "templated":false
        }
    }
}
actuator暴露的端点解释
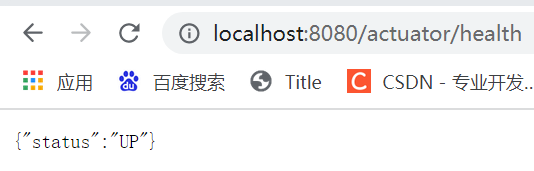
- 什么是actuator暴露的端点: 就是指标监控的一些选项,请求不同的端点可以获取到对应的指标信息,例如其中的"href"端点, 当我们请求"http://localhost:8080/actuator/health"时,通过该端点就可以知道当前应用是否正常提供服务,访问该地址会返回{“status”:“UP”},其中"UP"表示上线中,"DOWN"表示下线
 		"health":{
            "href":"http://localhost:8080/actuator/health",
            "templated":false
        },
- 也就是访问"服务域名:端口号/actuator"是进入actuator,而"actuator/后面的路径"就是访问对应的端点
- Actuator 默认提供了以下接口,具体如下表所示
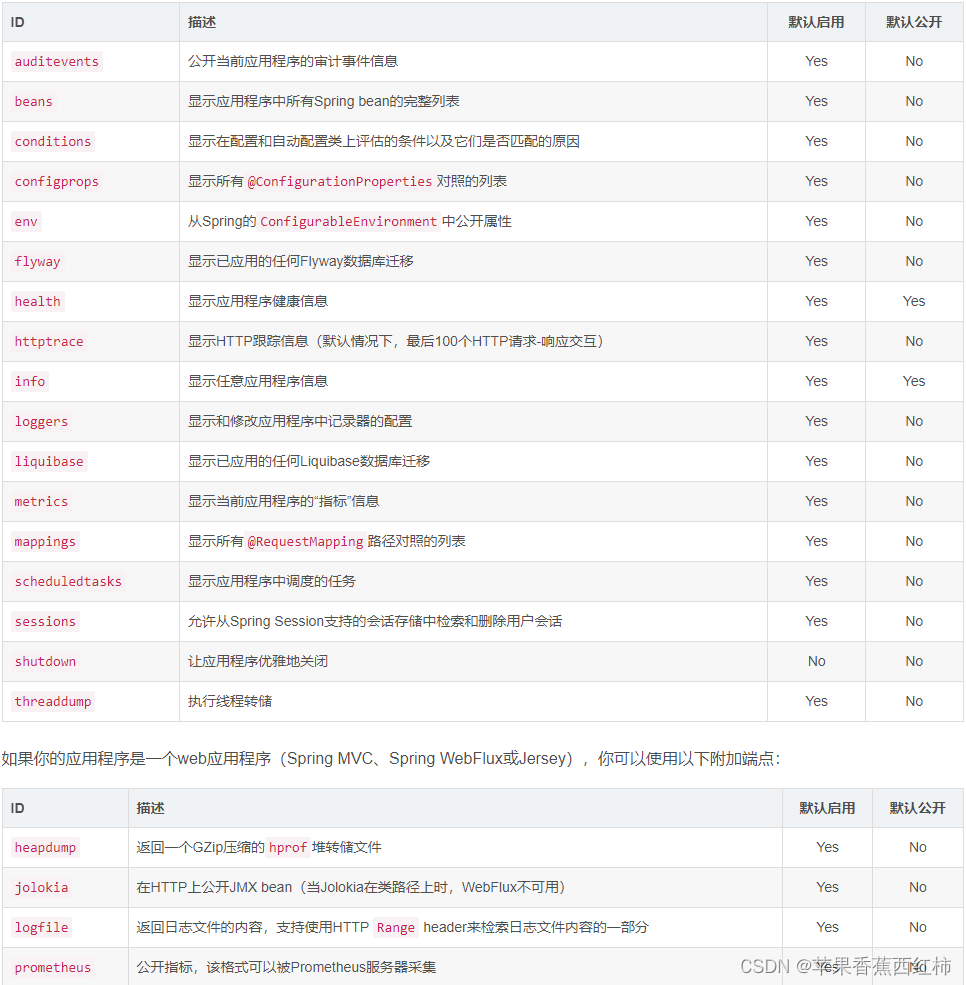
- 注意点Actuator默认情况下只暴露了"health"与"info"两个端点,如果想要暴露其它端点,需要配置启用端点,暴露端点
- 如果响应查看端点获取对应的详细信息yml中需要配置(注意SpringBoot1与SpringBoot可能不同)
# actuator 监控配置
management:
  endpoints:
    web:
      exposure:
        #默认值访问health,info端点  用*可以暴露全部端点
        include: "*"
  endpoint:
    health:
      show-details: always #获得健康检查中所有指标的详细信息
- 对上面yml示例中health配置的解释,health 端点公开的信息取决于management.endpoint.health.show-details属性
- never:不显示细节;
- when-authorized:详细信息只显示给授权用户,可以使用management.endpoint.health.roles配置授权角色;
- always:详细信息显示给所有用户
SpringBoot 2.0版本actuator相关配置与注意点
- Spring Boot 2.0的端点和之前的版本有较大不同,使用时需注意,端点的监控机制也有很大不同,启用了不代表可以直接访问,还需要将其暴露出来
- 传统的management.security管理已被标记为不推荐,现在一般使用单独启用并暴露
- 禁用的端点将从应用程序上下文中完全删除,如果只想公开端点(对外暴露),需要使用include和exclude属性属性
- applicatio.yml配置Actuator端点
server:
  port: 8080
spring:
  application:
    name: test-actuator-server
    group: com.demo.test
management:
  server:
    port: 8081 #actuator访问端口默认与server.port相同,为了安全通过此处可以指定端口
  endpoints:
    web:
      exposure:
        include: "*" # 暴露所有端口,默认info, health
        exclude: aaa #排除端点,exclude优先于include
      #默认情况下访问"服务域名:端口号/actuator/指定端点",通过该配置修改/actuator
      base-path: /monitor #修改/actuator为/monitor,此时再去访问就需要"服务域名:端口号/monitor/指定端点"
      #将指定端点映射到指定路径
      path-mapping:
        health: healthcheck # 将 health 端点重新映射为 healthcheck
    enabled-by-default: true # 启用所有端口
- 其它配置补充
# 禁用HTTP端点。如果不希望通过HTTP公开端点,则可以将管理端口设置为-1
management.port: -1
# 端点为不带任何参数的读取操作自动缓存响应,下面的示例将beans端点缓存的生存时间设置为10秒
management.endpoint.beans.cache.time-to-live: 10s
# 暴露所有端点。*在YAML中有特殊的含义,所以如果要包含(或排除)所有端点,请务必添加引号
management.endpoints.web.exposure.include: "*"
# 设置端点是否启用的默认值。示例为禁用所有的端点
management.endpoints.enabled-by-default: false
- 配置注意项
- 如果没有设置 management.server.port,management.endpoints.web.base-path是相对于server.servlet.context-path的;
- 如果设置了 management.server.port,management.endpoints.web.base-path是相对于management.server.servlet.context-path的;
自定义管理服务器地址
- 一台物理机可以安装多块网卡,或虚拟出多个IP, 通过management.server.address属性来指定管理端点使用的IP地址(注意:只有当管理端口与应用本身(服务提供者)使用端口不同时,才能监听不同的地址),比如我的机器有两个IP地址,分别为:192.168.1.10 和 192.168.1.11。其中,应用本身使用192.168.1.10地址,在application.yml 文件中添加如下配置项:(此时其他服务消费者调用服务时仍然调用192.168.1.10上的服务,要使用 Actuator 需要使用 192.168.1.11 地址。)
management.server.port: 8081
management.server.address: 192.168.1.11
配置管理特定SSL
- 当配置为使用自定义端口时,管理服务器还可以使用各种management.server.ssl.*属性配置自己的SSL。例如,这样做可以让管理服务器通过HTTP可用,而主应用程序使用HTTPS,如下面的属性设置所示
server.port: 8443
server.ssl.enabled: true
server.ssl.key-store: classpath:store.jks
server.ssl.key-password: secret
management.server.port: 8080
management.server.ssl.enabled: false
- 或者,主服务器和管理服务器都可以使用SSL,但密钥存储不同,如下所示
server.port: 8443
server.ssl.enabled: true
server.ssl.key-store: classpath:main.jks
server.ssl.key-password: secret

management.server.port: 8080
management.server.ssl.enabled: true
management.server.ssl.key-store: classpath:management.jks
management.server.ssl.key-password: secret
Actuator 在 Spring Boot 1.X 和Spring Boot 2.X 的差异
- 配置Key之间的变化:
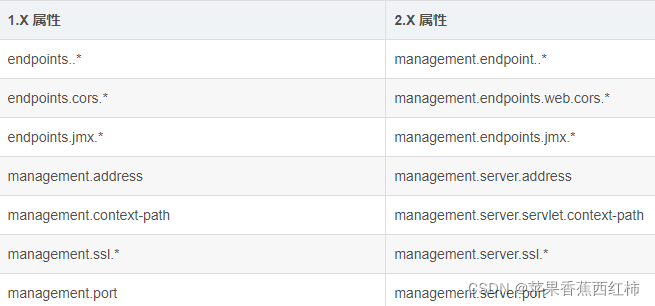
- 根节点发生了变化: 2.X 比1.X 多了一个根路径: /actuator 。当然你也可以通过 management.endpoints.web.base-path 设置一个根节点。如果你设置 management.server.servlet.context-path=/management 和 management.endpoints.web.base-path=/application,你就可以使用下面的路径访问 /health 端点:/management/application/health (注意: context-path只有在设置了 management.server.port 时才有效)
- 其它一些端点变化
- /autoconfig:更名为 /conditions;
- /docs:被废弃;
- /trace:更名为 /httptrace;
- /dump:更名为 /threaddump
info 端点详解
- 在使用info端点是需要注意如果要访问info接口想获取maven中的属性内容请记得添加如下内容
<build>
    <plugins>
        <plugin>
            <groupId>org.springframework.boot</groupId>
            <artifactId>spring-boot-maven-plugin</artifactId>
            <executions>
                <execution>
                    <goals>
                        <goal>build-info</goal>
                    </goals>
                </execution>
            </executions>
        </plugin>
    </plugins>
</build>
- 默认情况下当访问 http://localhost:8080/actuator/info 看到如下内容代表配置成功
{
  "blog-url": "http://blog.battcn.com",
  "author": "Levin",
  "version": "0.0.1-SNAPSHOT"
}
health 健康信息端点详解与HealthIndicator
- health 默认公开的端点,端点公开的信息取决于management.endpoint.health.show-details属性,可以取如下的值
- never:不显示细节(默认)
- when-authorized:详细信息只显示给授权用户,可以使用management.endpoint.health.roles配置授权角色;
- always:详细信息显示给所有用户
management:
  endpoints:
    web:
      exposure:
        include: "*" # 暴露所有端口,默认info, health
    enabled-by-default: true # 启用所有端口
  endpoint:
    health:
      show-details: always #配置显示health健康信息,默认never不显示,always为显示所有
- 当health配置为always显示所有信息是,访问"http://localhost:8080/actuator/health"会返回如下信息,服务状态是否up,是通过components中的信息判断得出的,components内部是根据ApplicationContext中定义的所有HealthIndicator bean中收集的,当引入某个组件有实现HealthIndicator,就可以通过对应的HealthIndicator收集到该组件的相关运行状态信息
{
    "status":"UP",
    "components":{
    	#diskSpace:表示硬盘空间,
        "diskSpace":{
            "status":"UP",#up表示正常上线状态
            "details":{
                "total":472506167296, #硬盘总容量
                "free":49352339456, #空闲容量
                "threshold":10485760,#线程占用率
                "exists":true
            }
        },
        #客户端与服务的是否可以通信
        "ping":{
            "status":"UP"
        }
    }
}
- 例如项目中添加了redis,influx,hystrix,再去访问"http://localhost:8080/actuator/health"就可以返回一下相关信息,注意点,只要其中有一个status状态为"DOWN"那么最外层表示服务状态的status就会为DOWN
{
    "status":"UP",
    "details":{
        "diskSpace":{
            "status":"UP",
            "details":{
                "total":472506167296,
                "free":49352318976,
                "threshold":10485760
            }
        },
        "influxDb":{
            "status":"UP",
            "details":{
                "version":"1.8.10"
            }
        },
        "refreshScope":{
            "status":"UP"
        },
        "hystrix":{
            "status":"UP"
        },
        "redis":{
            "status":"UP",
            "details":{
                "version":"5.0.7"
            }
        }
    }
}
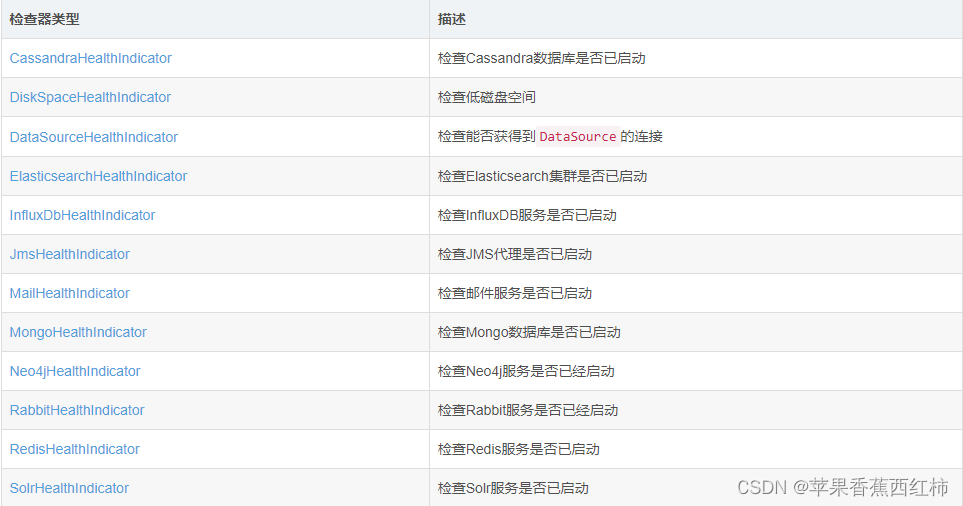
- 在引入spring-boot-xxx-starter后,Spring Boot提供了许多自动配置的HealthIndicators(如下面表格所示),也可以自定义,可以通过设置management.health.defaults.enabled属性来禁用它们所有。
实现HealthIndicator接口,自定义health返回状态
- 实现HealthIndicator接口,根据自己的需要判断返回的状态是UP还是DOWN,代码示例
package com.battcn.health;

import org.springframework.boot.actuate.health.Health;
import org.springframework.boot.actuate.health.HealthIndicator;
import org.springframework.stereotype.Component;

/**
 * <p>自定义健康端点</p>
 *
 * @author Levin
 * @since 2018/5/24 0024
 */
@Component("my1")
public class MyHealthIndicator implements HealthIndicator {
    private static final String VERSION = "v1.0.0";
    @Override
    public Health health() {
        int code = check();
        if (code != 0) {
            Health.down().withDetail("code", code).withDetail("version", VERSION).build();
        }
        return Health.up().withDetail("code", code)
                .withDetail("version", VERSION).up().build();
    }
    private int check() {
        return 0;
    }
}
- 启动项目,访问 http://localhost:8080/actuator/health 看到如下内容代表配置成功
{
  "status": "UP",
  "details": {
    "my1": {
      "status": "UP",
      "details": {
        "code": 0,
        "version": "v1.0.0"
      }
    },
    "diskSpace": {
      "status": "UP",
      "details": {
        "total": 100944310272,
        "free": 55071866880,
        "threshold": 10485760
      }
    }
  }
}
继承AbstractHealthIndicator,重写doHealthCheck方法,自定义health返回状态
- 继承AbstractHealthIndicator抽象类,重写doHealthCheck方法,功能比第一种要强大一点点,默认的DataSourceHealthIndicator 、 RedisHealthIndicator 都是这种写法,内容回调中还做了异常的处理
package com.battcn.health;
import org.springframework.boot.actuate.health.AbstractHealthIndicator;
import org.springframework.boot.actuate.health.Health;
import org.springframework.stereotype.Component;
/**
 * <p>自定义健康端点</p>
 * <p>功能更加强大一点,DataSourceHealthIndicator / RedisHealthIndicator 都是这种写法</p>
 *
 * @author Levin
 * @since 2018/5/24 0024
 */
@Component("my2")
public class MyAbstractHealthIndicator extends AbstractHealthIndicator {
    private static final String VERSION = "v1.0.0";
    @Override
    protected void doHealthCheck(Health.Builder builder) throws Exception {
        int code = check();
        if (code != 0) {
            builder.down().withDetail("code", code).withDetail("version", VERSION).build();
        }
        builder.withDetail("code", code)
                .withDetail("version", VERSION).up().build();
    }
    private int check() {
        return 0;
    }
}
- 启动项目,访问 http://localhost:8080/actuator/health 看到如下内容代表配置成功
{
  "status": "UP",
  "details": {
    "my2": {
      "status": "UP",
      "details": {
        "code": 0,
        "version": "v1.0.0"
      }
    },
    "my1": {...},
    "diskSpace": {...}
  }
}
自定义端点
- 上面介绍的 info、health 都是spring-boot-actuator内置的,可以通过@Endpoint、 @ReadOperation、@WriteOperation、@DeleteOperation 实现自己的端点
@Endpoint 构建 rest api 的唯一路径
@ReadOperation GET请求,响应状态为 200 如果没有返回值响应 404(资源未找到)
@WriteOperation POST请求,响应状态为 200 如果没有返回值响应 204(无响应内容)
@DeleteOperation DELETE请求,响应状态为 200 如果没有返回值响应 204(无响应内容)
- 自定义端点流程:
- 自定义端点类,通过@Endpoint注解修饰类,通过的id属性指定端点路径
- 通过@ReadOperation注解修饰自定义端点类中返回端点指标信息的方法
- 将端点类注入到容器中
- 自定义端点类示例
package com.battcn.endpoint;
import org.springframework.boot.actuate.endpoint.annotation.Endpoint;
import org.springframework.boot.actuate.endpoint.annotation.ReadOperation;
import java.util.HashMap;
import java.util.Map;
/**
 * <p>@Endpoint 是构建 rest 的唯一路径 </p>
 * 不同请求的操作,调用时缺少必需参数,或者使用无法转换为所需类型的参数,则不会调用操作方法,响应状态将为400(错误请求)
 * <P>@ReadOperation = GET 响应状态为 200 如果没有返回值响应 404(资源未找到) </P>
 * <P>@WriteOperation = POST 响应状态为 200 如果没有返回值响应 204(无响应内容) </P>
 * <P>@DeleteOperation = DELETE 响应状态为 200 如果没有返回值响应 204(无响应内容) </P>
 *
 * @author Levin
 * @since 2018/5/24 0024
 */
@Endpoint(id = "battcn")
public class MyEndPoint {
    @ReadOperation
    public Map<String, String> hello() {
        Map<String, String> result = new HashMap<>();
        result.put("author", "Levin");
        result.put("age", "24");
        result.put("email", "1837307557@qq.com");
        return result;
    }
}
- 将端点类作为配置类注入到容器中
package com.battcn;
import com.battcn.endpoint.MyEndPoint;
import org.springframework.boot.SpringApplication;
import org.springframework.boot.actuate.autoconfigure.endpoint.condition.ConditionalOnEnabledEndpoint;
import org.springframework.boot.autoconfigure.SpringBootApplication;
import org.springframework.boot.autoconfigure.condition.ConditionalOnMissingBean;
import org.springframework.context.annotation.Bean;
import org.springframework.context.annotation.Configuration;
/**
 * @author Levin
 */
@SpringBootApplication
public class Chapter13Application {
    public static void main(String[] args) {
        SpringApplication.run(Chapter13Application.class, args);
    }
    @Configuration
    static class MyEndpointConfiguration {
        @Bean
        @ConditionalOnMissingBean
        @ConditionalOnEnabledEndpoint
        public MyEndPoint myEndPoint() {
            return new MyEndPoint();
        }
    }
}
- 启动项目 访问"http://localhost:8080/actuator/battcn" 看到如下内容代表配置成功…
{
  "author": "Levin",
  "age": "24",
  "email": "1837307557@qq.com"
}
参考文档
- Spring Boot 参考指南(端点)
- 一起来学SpringBoot | 第十四篇:强大的 actuator 服务监控与管理
- springboot(十九):使用Spring Boot Actuator监控应用
三. 其它端点解释
conditions 端点解释
- 在编写代码时我们会用到@condition相关条件注入注解,而此处的就是查看对应的注入条件的
- 当访问"http://localhost:8080/actuator/conditions"就可以返回一下相关信息
{
    "contexts":{
        "test-actuator-server":{
            "positiveMatches":Object{...},
            "negativeMatches":Object{...},
            "unconditionalClasses":Array[12]
        }
    }
}
configprops 端点解释
- 访问"http://localhost:8080/actuator/configprops"查看该服务配置所有可配置信息
env 环境信息端点
- 访问"http://localhost:8080/actuator/env"查看该服务环境相关信息
loggers 与 logfile 日志相关端点
- 访问"http://localhost:8080/actuator/loggers"可以获取相关日志级别信息,并且可以通过工具配合actuator对指定类,或整个服务动态切换日志级别(集成admin后也可以在web端切换日志级别)
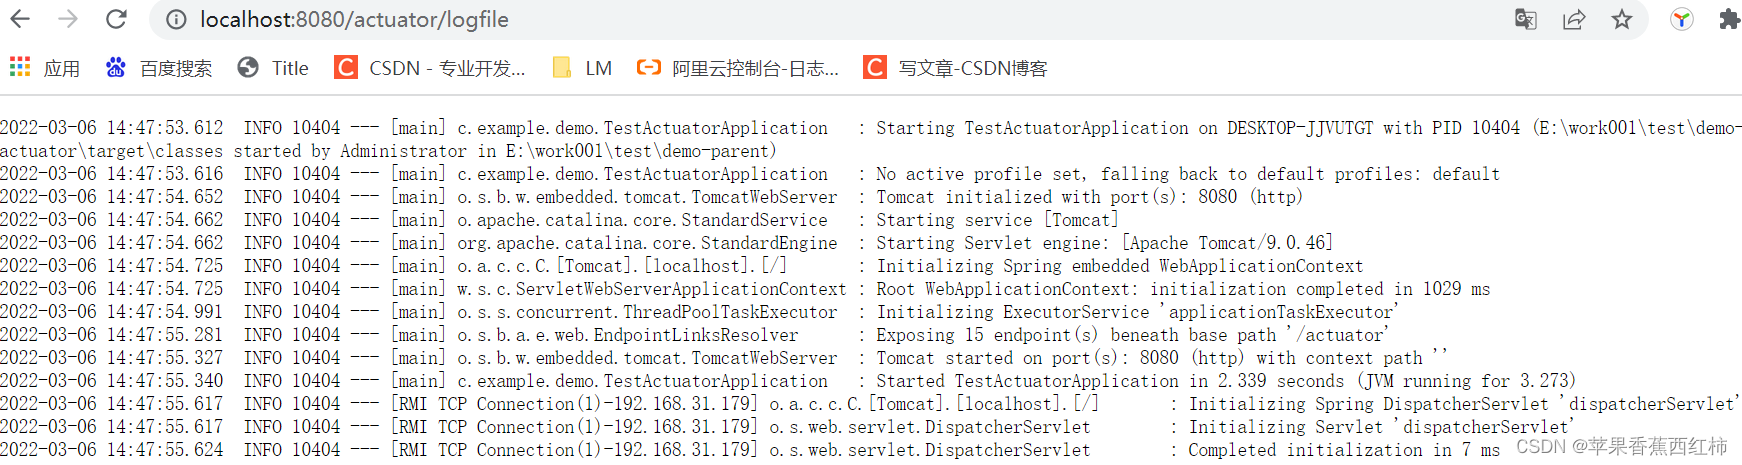
- 当配置服务日志保存到文件后,再次访问/actuator端点,会出现一个"logfile"端点
#配置文件中配置日志记录路径,文件名
logging:
  file:
    name: e:/logs/test-actuator.log
- 访问"http://localhost:8080/actuator/logfile"
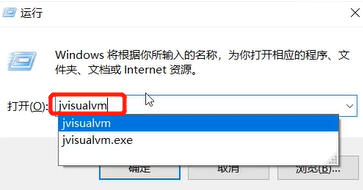
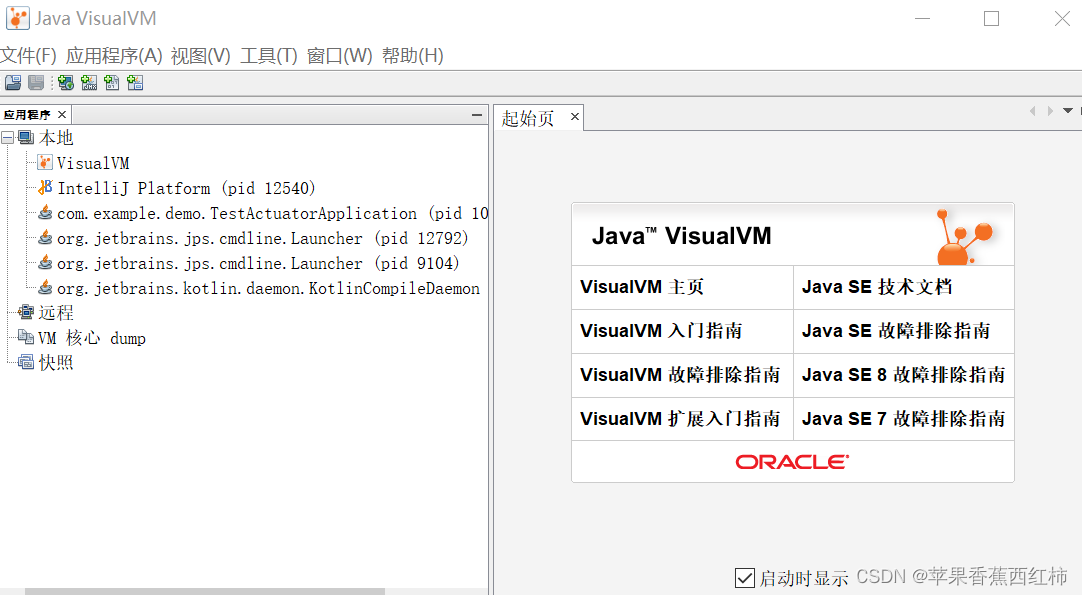
heapdump 端点与根据dump分析JVM
- 访问"http://localhost:8080/actuator/heapdump"下载dump文件,使用jvisualvm分析dump文件,可以分析jvm信息
threaddump 端点
- 访问"http://localhost:8080/actuator/threaddump" 获取线程状况
metrics 端点
- 访问"http://localhost:8080/actuator/metrics" 可以获取到查看服务其它指标的地址
{
    "names":[
        "http.server.requests",
        "jvm.buffer.count",
        "jvm.buffer.memory.used",
        "jvm.buffer.total.capacity",
        "jvm.classes.loaded",
        "jvm.classes.unloaded",
        "jvm.gc.live.data.size",
        "jvm.gc.max.data.size",
        "jvm.gc.memory.allocated",
        "jvm.gc.memory.promoted",
        "jvm.gc.pause",
        "jvm.memory.committed",
        "jvm.memory.max",
        "jvm.memory.used",
        "jvm.threads.daemon",
        "jvm.threads.live",
        "jvm.threads.peak",
        "jvm.threads.states",
        "logback.events",
        "process.cpu.usage",
        "process.start.time",
        "process.uptime",
        "system.cpu.count",
        "system.cpu.usage",
        "tomcat.sessions.active.current",
        "tomcat.sessions.active.max",
        "tomcat.sessions.alive.max",
        "tomcat.sessions.created",
        "tomcat.sessions.expired",
        "tomcat.sessions.rejected"
    ]
}
- 例如想要获取cpu个数则访问"http://localhost:8080/actuator/metrics/system.cpu.count" 返回
{
    "name":"system.cpu.count",
    "description":"The number of processors available to the Java virtual machine",
    "baseUnit":null,
    "measurements":[
        {
            "statistic":"VALUE",
            "value":8
        }
    ],
    "availableTags":[

    ]
}
shutdown 端点与服务的优雅关闭
- 当服务中有用户访问时,如果执行关闭服务,会直接返回错误给用户,体验不好,可以设置服务优雅关闭
- 服务优雅关闭需要配置 server.shutown 服务的关闭方式,默认immediate直接关闭,需要设置为graceful
- 然后访问"http://localhost:8080/actuator/shutdown" 注意点该接口需要post访问
- 此时如果关闭服务,会先判断是否有访问,如果有会等访问执行完毕后再关闭
四. SpringBoot Actuator 与 JMX
- 在上面做的Actuator 相关笔记讲解都是基于webHttp进行的,实际Actuator可以选择使用 HTTP 端点或 JMX 来管理和监视应用程
- 上面是JMX: 是JDK提供的一种监控管理框架, 通过JMX就可以结合使用JDK提供的监控工具,例如 JConsole
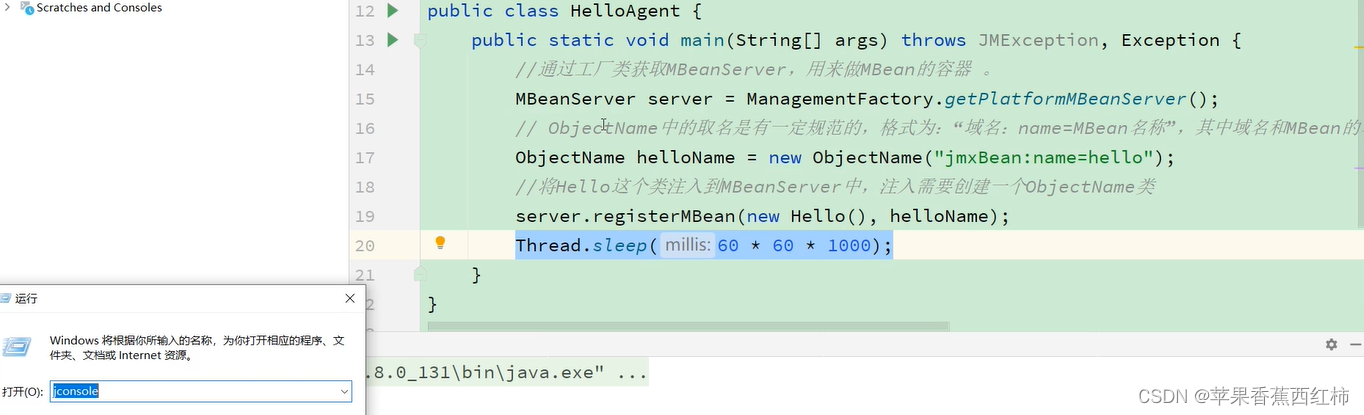
JConsole JMX 使用示例
- JConsole是JDK提供的监控工具
- JConsole与JMX配合使用时需要创建一个mBean,将这个mBean注入到MBeanServer中…
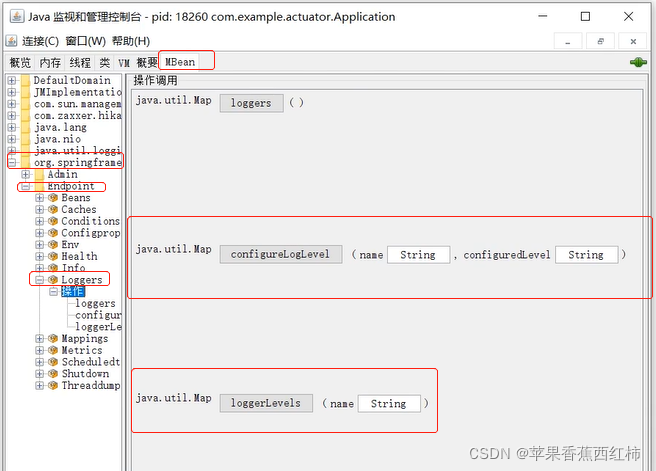
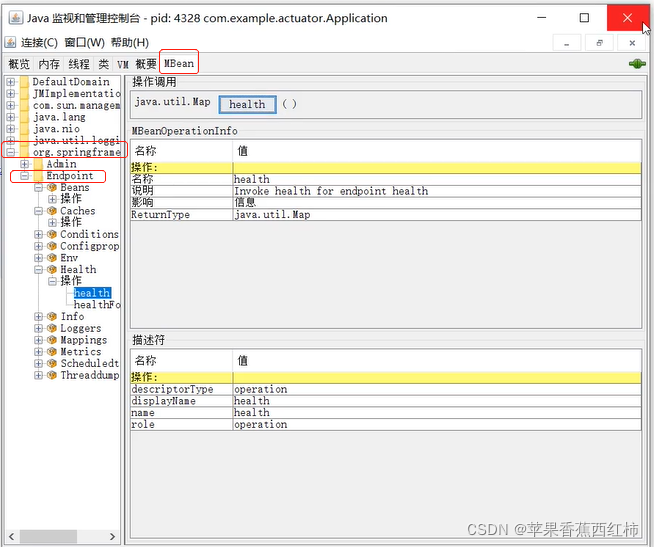
Actuator 与 JMX
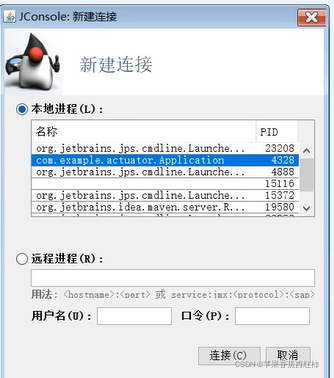
- 上面解释了JConsole, 在引入Actuator依赖后,也可以通过JConsole查看Actuator暴露的端点,进行监控
- 在执行jconsole时,选择连接actuator.Application
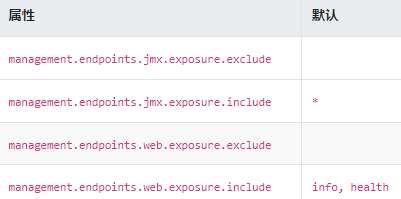
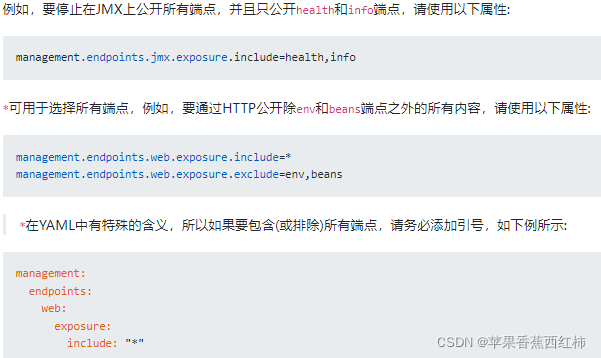
- 在Actuator中jmx方式与HTTP方式端点默认公开不同
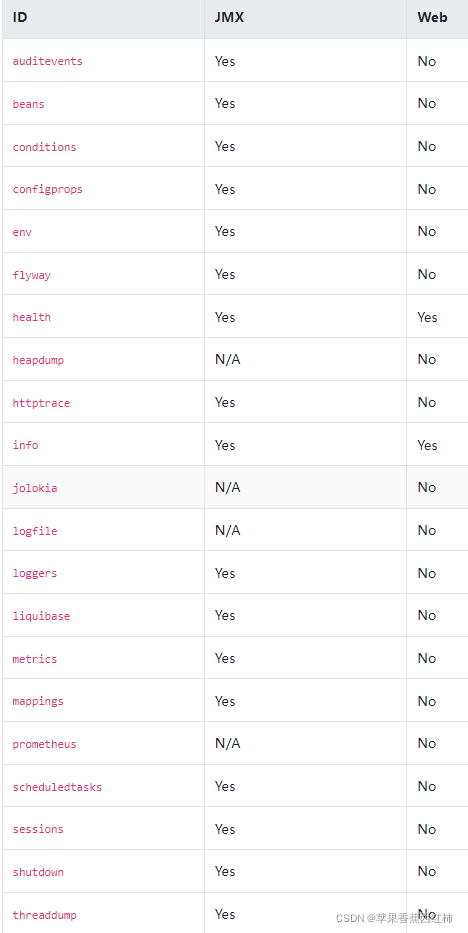
- 要更改公开的端点,请使用以下技术特定的include和exclude属性
五. 生产使用示例
- 需求: 亚朵单机版,项目运行在树莓派上, 为了查看到服务,服务相关组件运行状态,使用Actuator实现
- 实现步骤
- 引入Actuator依赖,配置开启端点,
- ymal配置开启端点,显示health端点详情
- 通过定时任务,定时请求health端点,获取相关组件状态,判断状态是否全部UP
- 将获取到的状态存储到redis,并设置失效时间
5.上层定时查询redis获取状态并展示
- 引入依赖
		<dependency>
            <groupId>org.springframework.boot</groupId>
            <artifactId>spring-boot-starter-actuator</artifactId>
        </dependency>
- yml相关配置
management:
  endpoint:
    metrics:
      enabled: true
    prometheus:
      enabled: true
    health:
      show-details: always
  endpoints:
    web:
      exposure:
        include:
          - prometheus
          - health
  metrics:
    export:
      prometheus:
        enabled: true
    tags:
      application: ${spring.application.name}
- 代码
- serverStateReportExecute()定时任务方法是入口
package com.roamblue.psb.adapter.service.impl;

import com.alibaba.fastjson.JSON;
import com.roamblue.psb.adapter.bean.response.HealthData;
import com.roamblue.psb.adapter.bean.response.ServerStatusReportResp;
import com.roamblue.psb.adapter.service.IServerStatusReportService;
import org.springframework.beans.factory.annotation.Autowired;
import org.springframework.beans.factory.annotation.Value;
import org.springframework.data.redis.core.RedisTemplate;
import org.springframework.http.HttpMethod;
import org.springframework.http.ResponseEntity;
import org.springframework.scheduling.annotation.Scheduled;
import org.springframework.stereotype.Service;
import org.springframework.web.client.RestTemplate;

import java.util.Map;
import java.util.Optional;
import java.util.concurrent.TimeUnit;
import java.util.stream.Collectors;

@Service
public class ServerStatusReportServiceImpl implements IServerStatusReportService {

    @Autowired
    private RedisTemplate<String, String> redisTemplate;

    @Autowired
    private RestTemplate restTemplate;

    @Value("${report.flag}")
    private Boolean reportFlag;

    private static final String UP_STATUS_KEY = "UP";

    private static final String REPORT_PATH = "http://localhost:8080/actuator/health";

    private static final String STATUS_KEY = "public:server:psb:status";

    private static final String START_INFO_KEY = "public:server:psb:info";

    private static boolean START_INFO_FLAG = true;


    public String queryActuatorHealthInfo() {
        ResponseEntity<String> responseEntity = restTemplate.exchange(REPORT_PATH, HttpMethod.GET, null, String.class);
        return responseEntity.getBody();
    }

	/**
	* 请求 "http://localhost:8080/actuator/health" 获取相关组件状态
	* 判断是否存在非UP状态的,如果存在返回err
	**/
    private ServerStatusReportResp checkHealthInfo(String healthInfoStr) {
        return Optional.ofNullable(healthInfoStr)
                .map(infoStr -> JSON.parseObject(infoStr, HealthData.class))
                .filter(health -> !UP_STATUS_KEY.equals(health.getStatus()))
                .map(HealthData::getDetails)
                .map(Map::entrySet)
                .map(entrySet -> {
                    return entrySet.stream()
                            .filter(entry -> !entry.getValue().toString().contains(UP_STATUS_KEY))
                            .map(entry -> entry.getKey())
                            .collect(Collectors.joining(","));
                })
                .map(downDetailStr -> ServerStatusReportResp.error(downDetailStr))
                .orElseGet(ServerStatusReportResp::ok);
    }

    @Override
    @Scheduled(fixedRate = 590000)
    public void serverStateReportExecute() {
        if (!reportFlag) {
            return;
        }
        String reportDesc = this.queryActuatorHealthInfo();
        ServerStatusReportResp resp = this.checkHealthInfo(reportDesc);
        if (START_INFO_FLAG) {
            redisTemplate.opsForValue().set(START_INFO_KEY, JSON.toJSONString(resp));
            START_INFO_FLAG = false;
        }
        redisTemplate.opsForValue().set(STATUS_KEY, resp.toString(), 60 * 10, TimeUnit.SECONDS);
    }
}


 3万+
3万+


 被折叠的 条评论
为什么被折叠?
被折叠的 条评论
为什么被折叠?
 到【灌水乐园】发言


