


文章目录
参考官方文档
https://grafana.com/docs/loki/latest/setup/install/local/
一、下载
下载2.8.6版本的promtail+loki:https://github.com/grafana/loki/releases/tag/v2.8.6
下载10.0.1版本的grafana https://grafana.com/grafana/download/10.0.1?platform=linux
wget https://dl.grafana.com/enterprise/release/grafana-enterprise-10.0.1.linux-amd64.tar.gz
二、创建安装目录
[root@localhost logsCollect]# mkdir loki promtail grafana data
[root@localhost logsCollect]# ll
总用量 0
drwxr-xr-x. 2 root root 6 3月   4 11:49 data
drwxr-xr-x. 2 root root 6 3月   4 11:49 grafana
drwxr-xr-x. 2 root root 6 3月   4 11:49 loki
drwxr-xr-x. 2 root root 6 3月   4 11:49 promtail
[root@localhost logsCollect]# cd data
[root@localhost data]# mkdir chunks index
[root@localhost data]# ll
总用量 0
drwxr-xr-x. 2 root root 6 3月   4 11:49 chunks
drwxr-xr-x. 2 root root 6 3月   4 11:49 index
[root@localhost data]# pwd
/usr/local/logsCollect/data
- 以下目录用来存放各个组件压缩包的解压文件和配置
/usr/local/logsCollect/loki
/usr/local/logsCollect/grafana
/usr/local/logsCollect/promtail - 以下目录用来文件存储和索引存储
/usr/local/logsCollect/data/loki/chunks
/usr/local/logsCollect/data/loki/index
三、安装Loki
- 解压
loki-linux-amd64.zip到/usr/local/logsCollect/loki
[root@localhost loki]# pwd
/usr/local/logsCollect/loki
[root@localhost loki]# ll
总用量 18556
-rw-r--r--. 1 root root 18998204 3月   4 15:18 loki-linux-amd64.zip
[root@localhost loki]# unzip loki-linux-amd64.zip
Archive:  loki-linux-amd64.zip
  inflating: loki-linux-amd64
[root@localhost loki]# ll
总用量 76796
-rwxr-xr-x. 1 root root 59637760 10月 17 2023 loki-linux-amd64
-rw-r--r--. 1 root root 18998204 3月   4 15:18 loki-linux-amd64.zip
[root@localhost loki]#
- 修改配置
loki-local-config.yaml
获取官方通用配置
wget https://raw.githubusercontent.com/grafana/loki/v2.8.6/cmd/loki/loki-local-config.yaml
[root@localhost loki]# ll
总用量 76796
-rwxr-xr-x. 1 root root 59637760 10月 17 2023 loki-linux-amd64
-rw-r--r--. 1 root root 18998204 3月   4 15:18 loki-linux-amd64.zip
[root@localhost loki]# wget https://raw.githubusercontent.com/grafana/loki/v2.8.6/cmd/loki/loki-local-config.yaml
--2025-03-04 15:28:29--  https://raw.githubusercontent.com/grafana/loki/v2.8.6/cmd/loki/loki-local-config.yaml
正在解析主机 raw.githubusercontent.com (raw.githubusercontent.com)... 185.199.111.133, 185.199.108.133, 185.199.109.133, ...
正在连接 raw.githubusercontent.com (raw.githubusercontent.com)|185.199.111.133|:443... 已连接。
已发出 HTTP 请求,正在等待回应... 200 OK
长度:1296 (1.3K) [text/plain]
正在保存至: “loki-local-config.yaml”

100%[========================================================================>] 1,296       --.-K/s 用时 0s

2025-03-04 15:28:30 (80.4 MB/s) - 已保存 “loki-local-config.yaml” [1296/1296])

[root@localhost loki]# ll
总用量 76800
-rwxr-xr-x. 1 root root 59637760 10月 17 2023 loki-linux-amd64
-rw-r--r--. 1 root root 18998204 3月   4 15:18 loki-linux-amd64.zip
-rw-r--r--. 1 root root     1296 3月   4 15:28 loki-local-config.yaml
[root@localhost loki]#
获取到的默认配置如下
auth_enabled: false

server:
  http_listen_port: 3100
  grpc_listen_port: 9096

common:
  instance_addr: 127.0.0.1
  path_prefix: /tmp/loki
  storage:
    filesystem:
      chunks_directory: /tmp/loki/chunks
      rules_directory: /tmp/loki/rules
  replication_factor: 1
  ring:
    kvstore:
      store: inmemory

query_range:
  results_cache:
    cache:
      embedded_cache:
        enabled: true
        max_size_mb: 100

schema_config:
  configs:
    - from: 2020-10-24
      store: boltdb-shipper
      object_store: filesystem
      schema: v11
      index:
        prefix: index_
        period: 24h

ruler:
  alertmanager_url: http://localhost:9093

# By default, Loki will send anonymous, but uniquely-identifiable usage and configuration
# analytics to Grafana Labs. These statistics are sent to https://stats.grafana.org/
#
# Statistics help us better understand how Loki is used, and they show us performance
# levels for most users. This helps us prioritize features and documentation.
# For more information on what's sent, look at
# https://github.com/grafana/loki/blob/main/pkg/usagestats/stats.go
# Refer to the buildReport method to see what goes into a report.
#
# If you would like to disable reporting, uncomment the following lines:
#analytics:
#  reporting_enabled: false
- 启动
- 命令行启动
./loki-linux-amd64 -config.file=loki-local-config.yaml - 后台运行
nohup ./loki-linux-amd64 -config.file=loki-local-config.yaml > server.log 2>&1 &
nohup忽略终端关闭的信号,即终端关闭仍然运行
./loki-linux-amd64 --config.file=loki-local-config.yaml > server.log将执行./loki-linux-amd64 --config.file=loki-local-config.yaml命令产生的标准输出(stdout),输入到server.log里
2>&1将标准错误输出(stderr)重定向到 server.log 文件
&将进程放到后台运行,不会阻塞当前终端
- 启动脚本
#!/bin/bash
nohup ./loki-linux-amd64 -config.file=loki-local-config.yaml >./server.log 2>&1 &
echo "$!" > pid
- 结束运行脚本
#!/bin/bash
kill -9 `cat pid`
echo "关闭成功!"
四、安装Promtail
- 解压
promtail-linux-amd64.zip到/usr/local/logsCollect/promtail - 配置
promtail-local-config.yaml
获取通用配置
wget https://raw.githubusercontent.com/grafana/loki/v2.8.6/clients/cmd/promtail/promtail-local-config.yaml
[root@localhost promtail]# pwd
/usr/local/logsCollect/promtail
[root@localhost promtail]# ll
总用量 25636
-rw-r--r--. 1 root root 26247434 3月   4 15:18 promtail-linux-amd64.zip
[root@localhost promtail]# unzip promtail-linux-amd64.zip
Archive:  promtail-linux-amd64.zip
  inflating: promtail-linux-amd64
[root@localhost promtail]# wget https://raw.githubusercontent.com/grafana/loki/v2.8.6/clients/cmd/promtail/promtail-local-config.yaml
--2025-03-04 15:31:56--  https://raw.githubusercontent.com/grafana/loki/v2.8.6/clients/cmd/promtail/promtail-local-config.yaml
正在解析主机 raw.githubusercontent.com (raw.githubusercontent.com)... 185.199.108.133, 185.199.110.133, 185.199.111.133, ...
正在连接 raw.githubusercontent.com (raw.githubusercontent.com)|185.199.108.133|:443... 已连接。
已发出 HTTP 请求,正在等待回应... 200 OK
长度:303 [text/plain]
正在保存至: “promtail-local-config.yaml”

100%[========================================================================>] 303         --.-K/s 用时 0s

2025-03-04 15:31:58 (26.9 MB/s) - 已保存 “promtail-local-config.yaml” [303/303])

[root@localhost promtail]# ll
总用量 114380
-rwxr-xr-x. 1 root root 90869256 10月 17 2023 promtail-linux-amd64
-rw-r--r--. 1 root root 26247434 3月   4 15:18 promtail-linux-amd64.zip
-rw-r--r--. 1 root root      303 3月   4 15:31 promtail-local-config.yaml
[root@localhost promtail]#
默认配置如下
server:
  http_listen_port: 9080
  grpc_listen_port: 0

positions:
  filename: /tmp/positions.yaml

clients:
  - url: http://localhost:3100/loki/api/v1/push

scrape_configs:
- job_name: system
  static_configs:
  - targets:
      - localhost
    labels:
      job: varlogs
      __path__: /var/log/*log
-
启动
nohup ./promtail-linux-amd64 -config.file=promtail-local-config.yaml > server.log 2>&1 & -
修改后的配置文件
promtail-local-config.yaml
server:
  http_listen_port: 9080
  grpc_listen_port: 0

positions:
  filename: /usr/your/path/promtail/positions.yaml # postions.yaml文件路径

clients:
  - url: http://42.193.148.250:3101/loki/api/v1/push

scrape_configs:
- job_name: system
  file_sd_configs:
  - files:
    - /usr/your/path/promtail/scrape-files-config.yaml
    refresh_interval: 5m
新增的配置文件scrape-files-config.yaml
# a-server
- targets: ["localhost"]
  labels:
    app: a-server
    env: test
    remark: info
    __path__: /app/logs/a-server/*info*.log
- targets: ["localhost"]
  labels:
    app: a-server
    env: test
    remark: debug
    __path__: /app/logs/a-server/*debug*.log
# b-server
- targets: ["localhost"]
  labels:
    app: b-server
    env: test
    remark: info
    __path__: /app/logs/b-server/*info*.log
- targets: ["localhost"]
  labels:
    app: b-server
    env: test
    remark: debug
    __path__: /app/logs/b-server/*debug*.log
五、安装Grafana
- 解压grafana-enterprise-10.0.1.linux-amd64.tar.gz
(tar -xzvf )。注意conf/defaults.ini为grafana的配置文件。 - 修改配置conf/defaults.ini
http_port 默认为3000
- 启动
- 命令行后台启动
nohup ./bin/grafana-server >server.log 2>&1 &
六、浏览器进入Grafana
192.168.244.128:3000 默认账号密码admin/admin
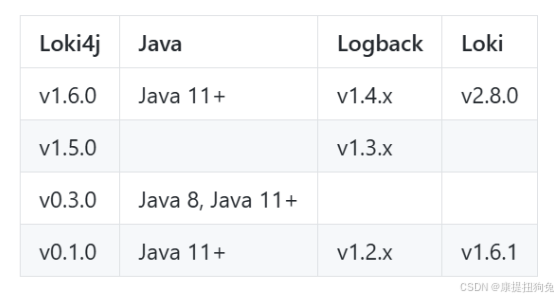
七、如果不用promtail,可以用loki-logback-appender
loki-logback-appender文档
https://loki4j.github.io/loki-logback-appender/docs/migration
版本对应
logback.xml里的appender配置
    <appender name="LOKI" class="com.github.loki4j.logback.Loki4jAppender">
        <batchMaxItems>100</batchMaxItems>
        <batchTimeoutMs>10000</batchTimeoutMs>
        <verbose>true</verbose>
        <http class="com.github.loki4j.logback.ApacheHttpSender">
            <url>http://192.168.244.128:3100/loki/api/v1/push</url>
            <requestTimeoutMs>10000</requestTimeoutMs>
        </http>
        <format>
            <label>
                <pattern>application=inner-server,env=test,level=%level,host=${HOSTNAME}</pattern>
                <readMarkers>true</readMarkers>
            </label>
            <layout class="ch.qos.logback.classic.PatternLayout">
                <Pattern>%d{yyyy-MM-dd'T'HH:mm:ss.SSSXXX} %level [%thread] [%logger{50}.%method:%line] %msg%n</Pattern>
            </layout>
            <sortByTime>true</sortByTime>
        </format>
    </appender>


 1059
1059

 被折叠的 条评论
为什么被折叠?
被折叠的 条评论
为什么被折叠?
 到【灌水乐园】发言


