


本文转载于个人博客:https://docs.wziqi.vip/
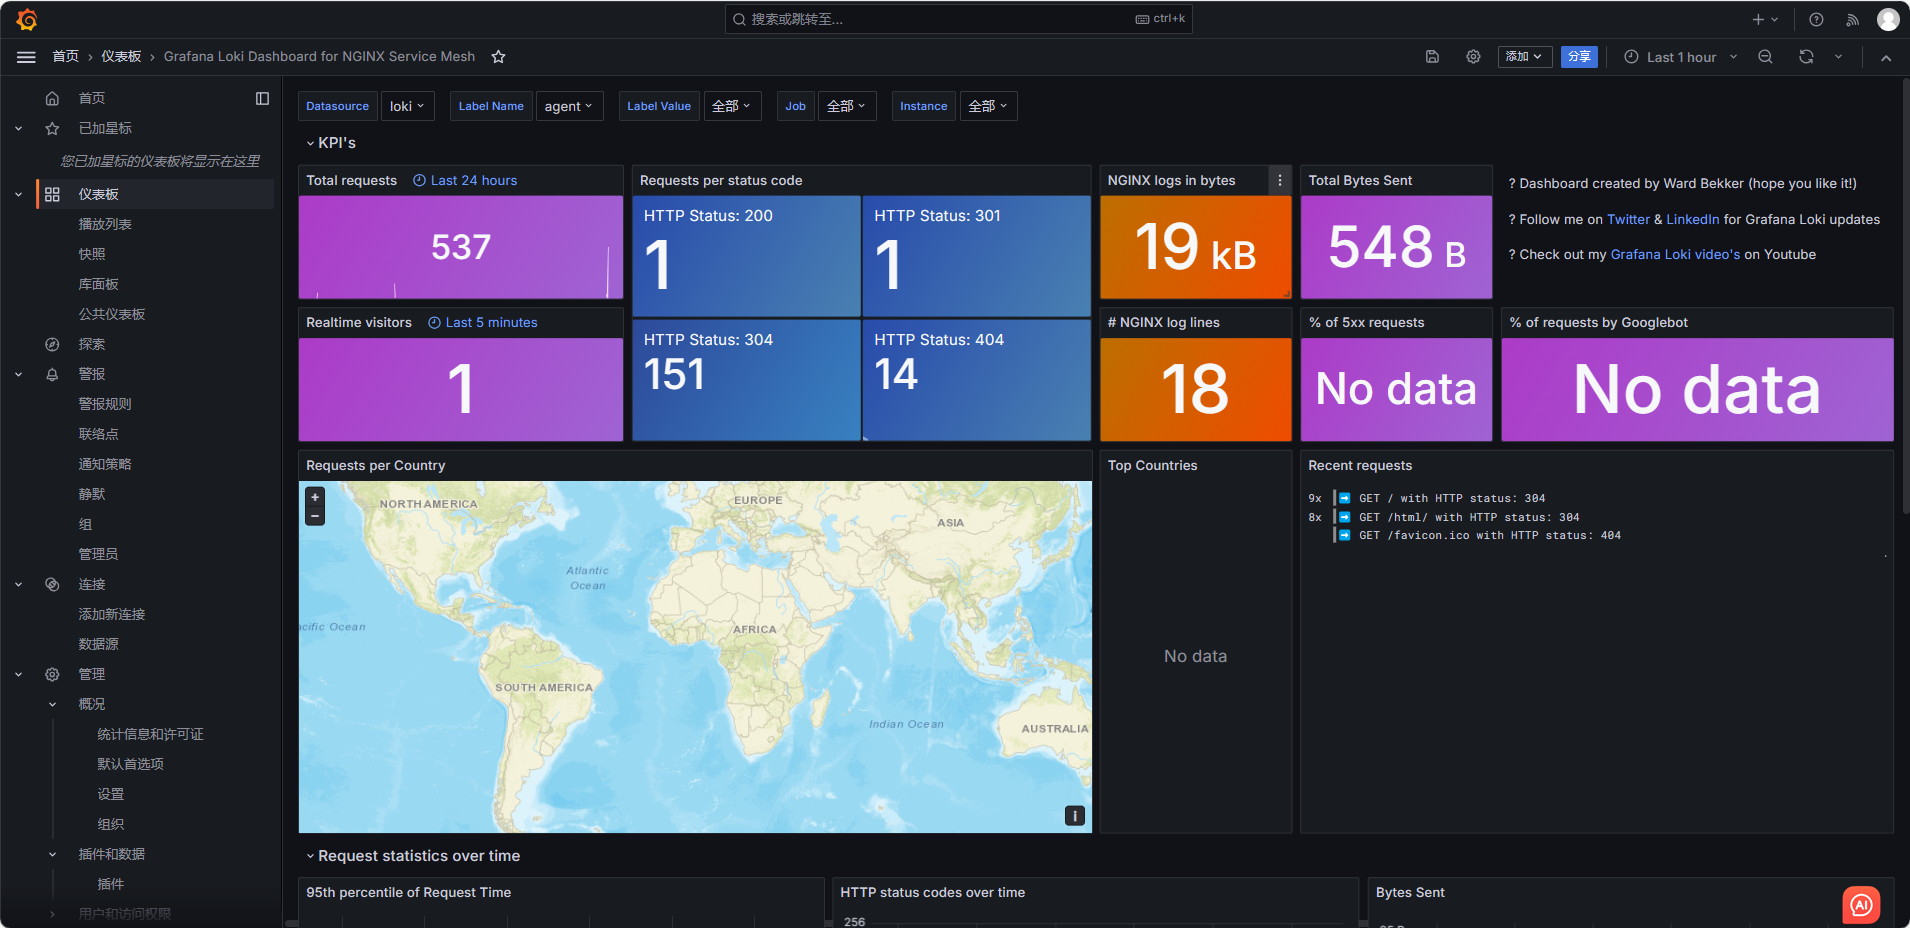
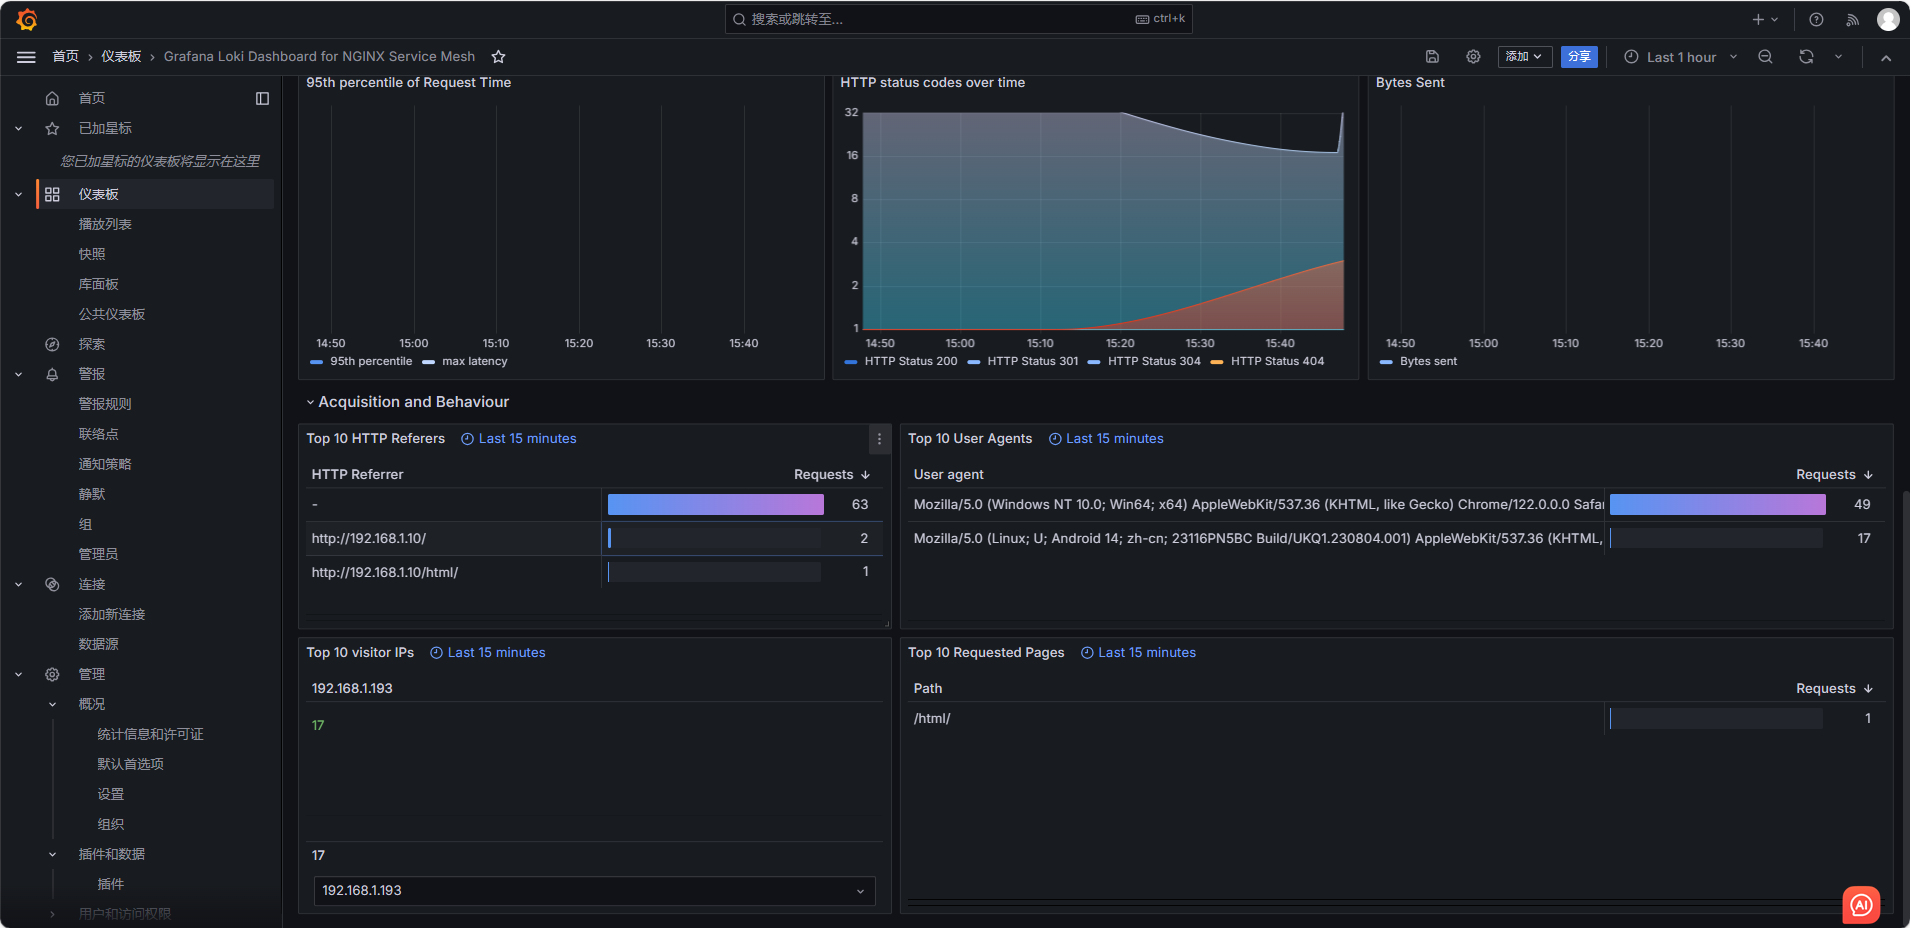
先看下最终效果图:
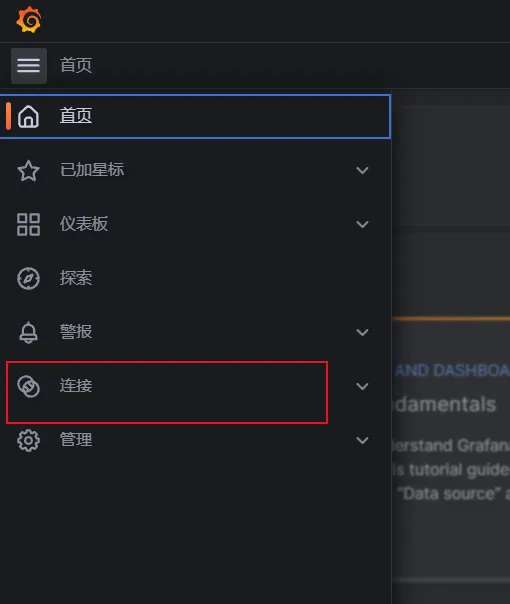
Loki + Promtail简介
Loki是个日志监控系统,可用来分析日志,并提供给Grafana进行图形化展示,他的数据主要是由promtail 来收集的。
Promtail是个日志转发的代理,用于给Loki提供日志数据的。
第一步先安装 loki
1.1 切换到工作目录下,如果自己创建的不是这个目录下边启动容器的映射也得改
mkdir -p /etc/loki/conf && cd /etc/loki/conf && chmod 0777 -R /etc/loki1.2 下载配置文件
wget https://raw.githubusercontent.com/grafana/loki/master/cmd/loki/loki-local-config.yaml1.3 配置文件详解
auth_enabled: false # 是否启用鉴权

server:
   http_listen_port: 3100 #http访问端口
   grpc_listen_port: 9096 #rpc访问端口

common:
   path_prefix: /tmp/loki #loki
 storage:
 filesystem:
 chunks_directory: /tmp/loki/chunks #记录块存储目录,默认chunks块上的日志数量或到期后,将chunks数据打标签后存储
 rules_directory: /tmp/loki/rules #规则配置目录
 replication_factor: 1
 ring:
 instance_addr: 192.168.1.1 #修改为自己的IP或localhost
 kvstore:
 store: inmemory

query_range: #查询规则
 results_cache: #结果缓存
 cache:
# embedded_cache: #默认开启后会有提示,未配置缓存项,暂不开启
# enabled: true
# distributed: true
# max_size_mb: 100

schema_config: #配置索引信息
 configs:
 - from: 2020-10-24
 store: boltdb-shipper
 object_store: filesystem
 schema: v11
 index:
 prefix: index_ #索引前缀
 period: 24h #索引时长

ruler:
 alertmanager_url: http://192.168.1.1:9093 #告警通知url,修改为自己的IP
1.4 启动服务
docker run -d --name loki --privileged=true \
--restart always -p 3100:3100 -p 9096:9096 \
-e TZ="Asia/Shanghai" -m 512m \
-v /etc/localtime:/etc/localtime:ro \
-v /usr/share/zoneinfo/:/usr/share/zoneinfo/:ro \
-v /etc/loki/conf:/mnt/config grafana/loki:2.8.2 \
-config.file=/mnt/config/loki-local-config.yaml
第二步安装 Promtail
2.1 切换到工作目录下,如果自己创建的不是这个目录下边启动容器的映射也得改
cd /etc/loki/conf2.2 下载配置文件
wget https://raw.githubusercontent.com/grafana/loki/main/clients/cmd/promtail/promtail-local-config.yaml2.3 配置文件详解
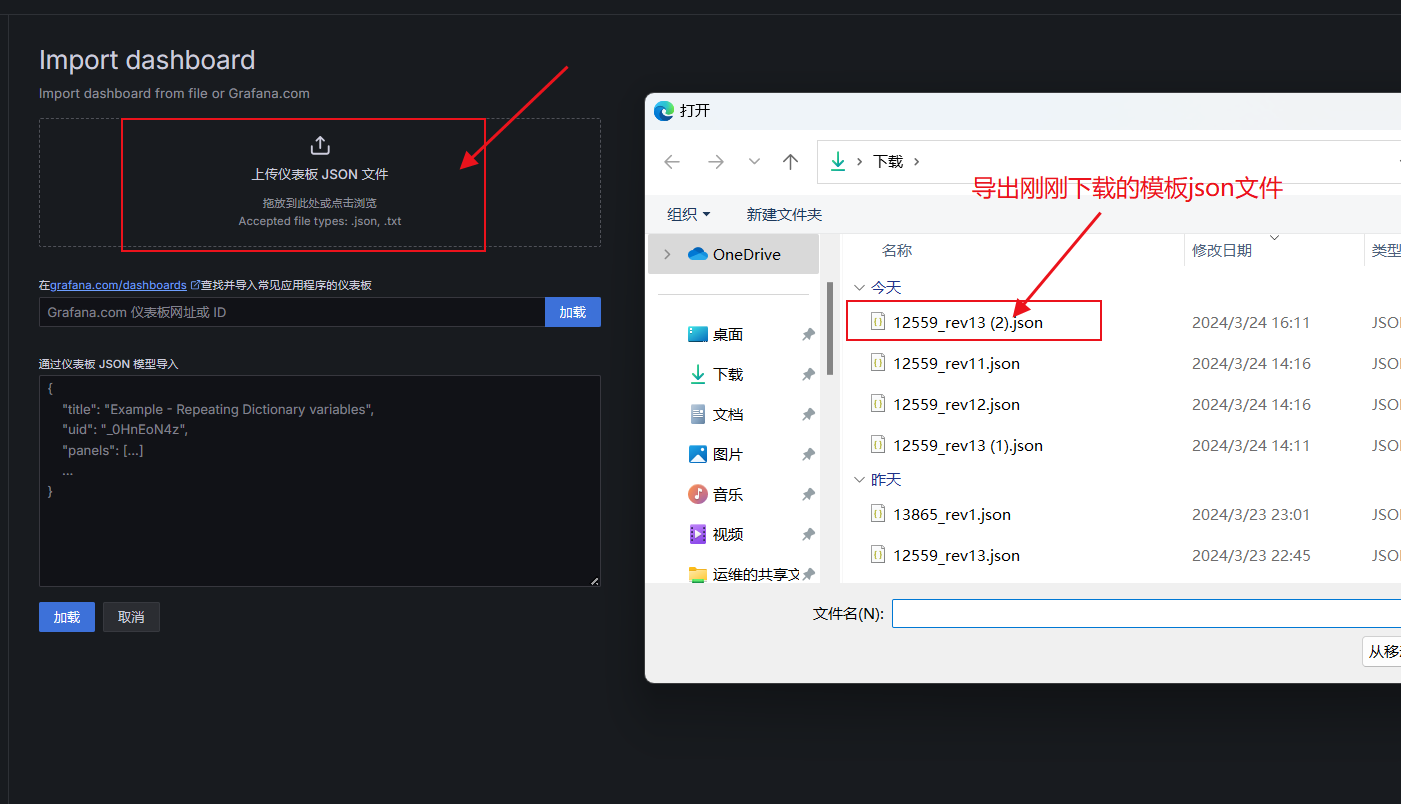
grafana模板地址:https://grafana.com/grafana/dashboards/12559-loki-nginx-service-mesh-json-version/
server:
http_listen_port: 9080
grpc_listen_port: 0
positions:
filename: /tmp/positions.yaml #用于记录每次读取日志文件的索引行数,如:promtail重启后从该配置中恢复日志文件的读取位置
clients:
#- url: http://192.168.1.10:3100/loki/api/v1/push #推送日志流到Loki中的api
- url: http://192.168.1.10:3100/loki/api/v1/push #推送日志流到Loki中的api
scrape_configs:
- job_name: system
#pipeline_stages:
#- replace: # 这边是用来对收集到的ip进行加密的
# expression: '(?:[0-9]{1,3}\.){3}([0-9]{1,3})' # 如果不注释grafana展示的IP为"192.168.1.***"
# replace: '***' # 如果注释的话就是全部显示"192.168.1.111"
static_configs:
- targets:
- localhost # 根据官方文档,这里只能是localhost
labels:
job: nginx_log
host: appfelstrudel
agent: promtail
__path__: /var/log/access.log # 这边修改为nginx的日志地址上边两步都部署好之后需要在修改一下nginx配置文件,把日志格式调整一下
参考文档:"Loki NGINX Service Mesh - JSON version | Grafana Labs"
第三步修改Nginx配置文件
vim /etc/nginx/nginx.conf
 log_format json_analytics '{'
       '"msec": "$msec", ' # request unixtime in seconds with a milliseconds resolution
       '"connection": "$connection", ' # connection serial number
       '"connection_requests": "$connection_requests", ' # number of requests made in connection
        '"pid": "$pid", ' # process pid
        '"request_id": "$request_id", ' # the unique request id
        '"request_length": "$request_length", ' # request length (including headers and body)
        '"remote_addr": "$remote_addr", ' # client IP
        '"remote_user": "$remote_user", ' # client HTTP username
        '"remote_port": "$remote_port", ' # client port
        '"time_local": "$time_local", '
        '"time_iso8601": "$time_iso8601", ' # local time in the ISO 8601 standard format
        '"request": "$request", ' # full path no arguments if the request
        '"request_uri": "$request_uri", ' # full path and arguments if the request
        '"args": "$args", ' # args
        '"status": "$status", ' # response status code
        '"body_bytes_sent": "$body_bytes_sent", ' # the number of body bytes exclude headers sent to a client
        '"bytes_sent": "$bytes_sent", ' # the number of bytes sent to a client
        '"http_referer": "$http_referer", ' # HTTP referer
        '"http_user_agent": "$http_user_agent", ' # user agent
        '"http_x_forwarded_for": "$http_x_forwarded_for", ' # http_x_forwarded_for
        '"http_host": "$http_host", ' # the request Host: header
        '"server_name": "$server_name", ' # the name of the vhost serving the request
        '"request_time": "$request_time", ' # request processing time in seconds with msec resolution
        '"upstream": "$upstream_addr", ' # upstream backend server for proxied requests
        '"upstream_connect_time": "$upstream_connect_time", ' # upstream handshake time incl. TLS
        '"upstream_header_time": "$upstream_header_time", ' # time spent receiving upstream headers
        '"upstream_response_time": "$upstream_response_time", ' # time spend receiving upstream body
        '"upstream_response_length": "$upstream_response_length", ' # upstream response length
        '"upstream_cache_status": "$upstream_cache_status", ' # cache HIT/MISS where applicable
        '"ssl_protocol": "$ssl_protocol", ' # TLS protocol
        '"ssl_cipher": "$ssl_cipher", ' # TLS cipher
        '"scheme": "$scheme", ' # http or https
        '"request_method": "$request_method", ' # request method
        '"server_protocol": "$server_protocol", ' # request protocol, like HTTP/1.1 or HTTP/2.0
        '"pipe": "$pipe", ' # "p" if request was pipelined, "." otherwise
        '"gzip_ratio": "$gzip_ratio", '
        '"http_cf_ray": "$http_cf_ray"'
 '}';

 access_log /var/log/access.log json_analytics; # 这边修改为上边promtail配置文件中指定的日志路径
: wq # 保存并退出
nginx -t # 检查配置文件是否有问题
nginx -s reload # 重新加载配置文件第四步配置
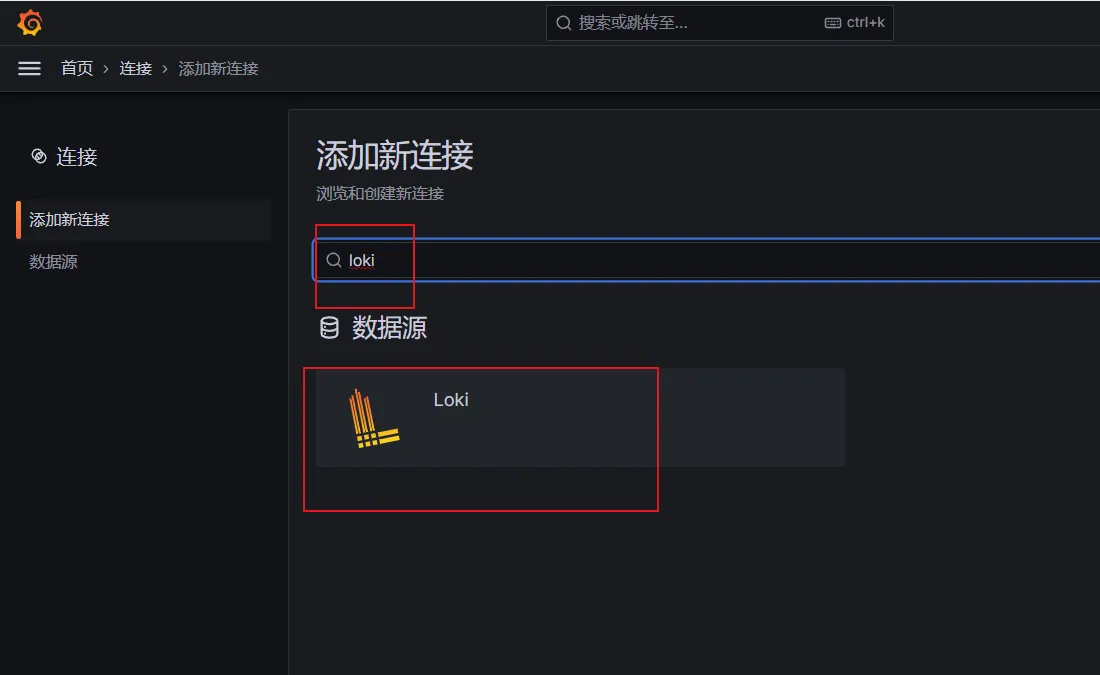
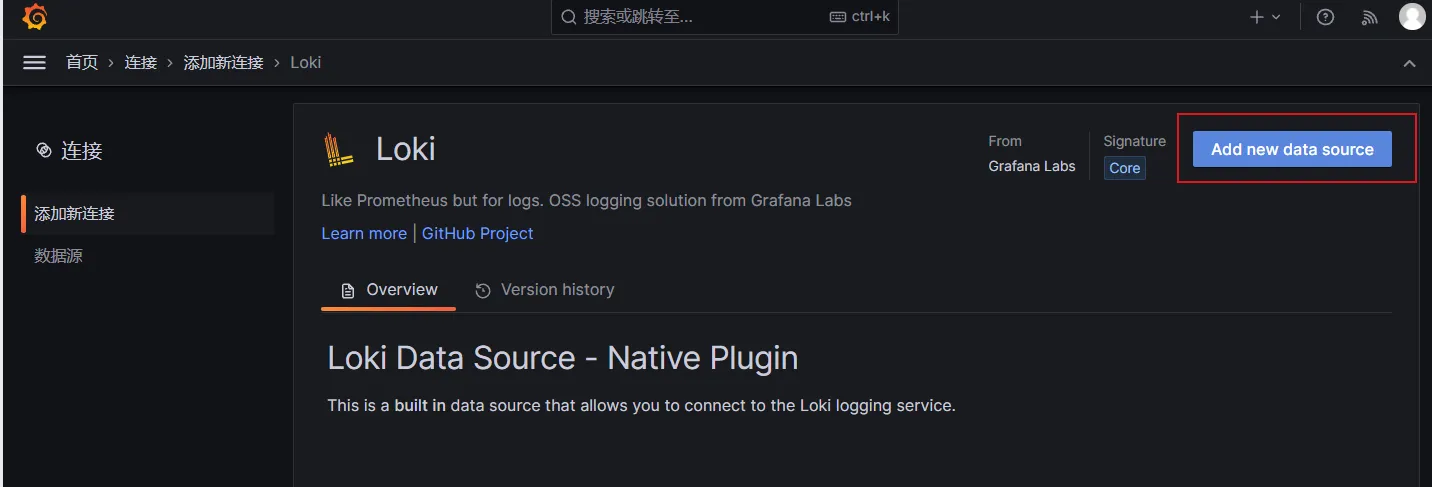
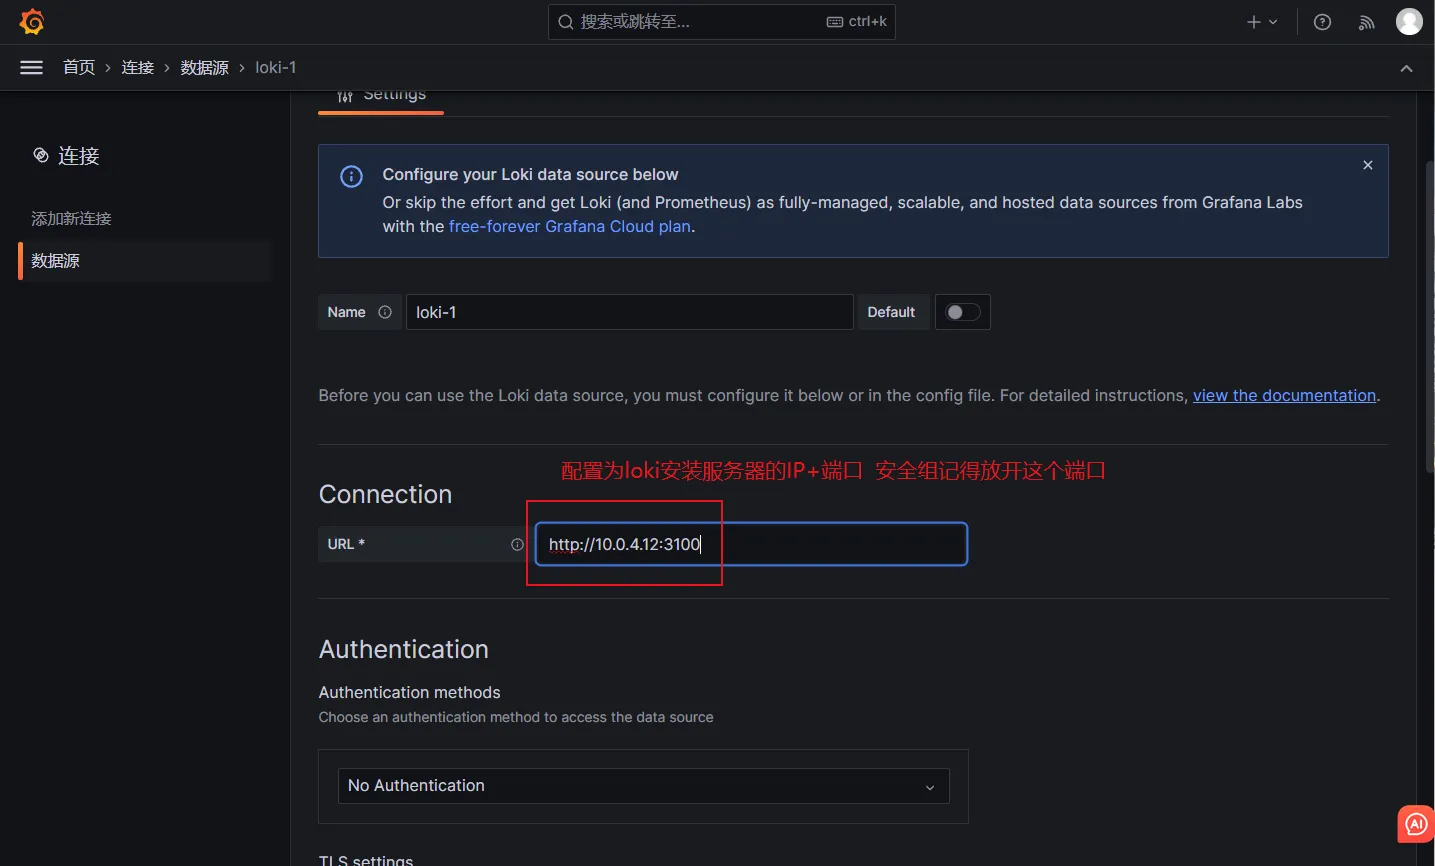
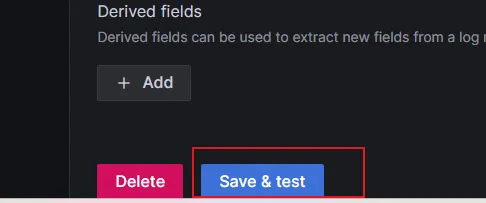
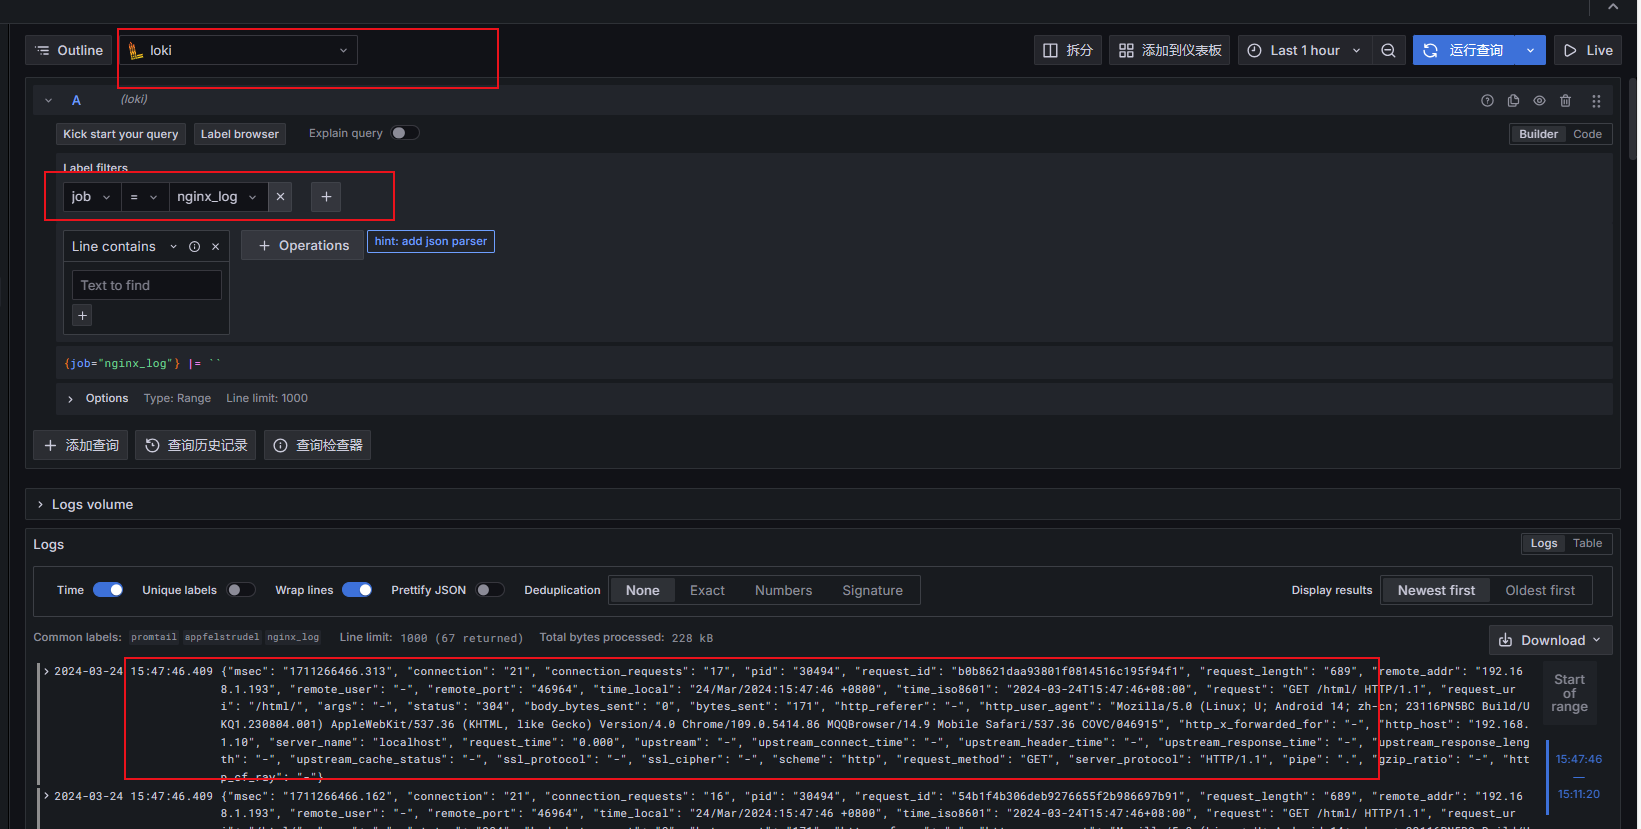
上边都配置好之后打开 grafana 添加数据源看下日志是否正常
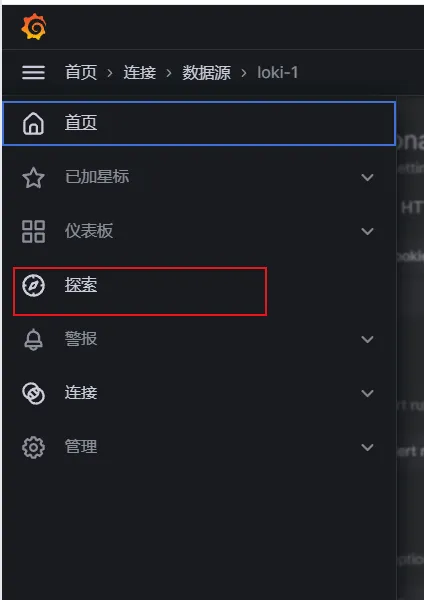
到这一步,可以查看到日志已经成功百分之90了
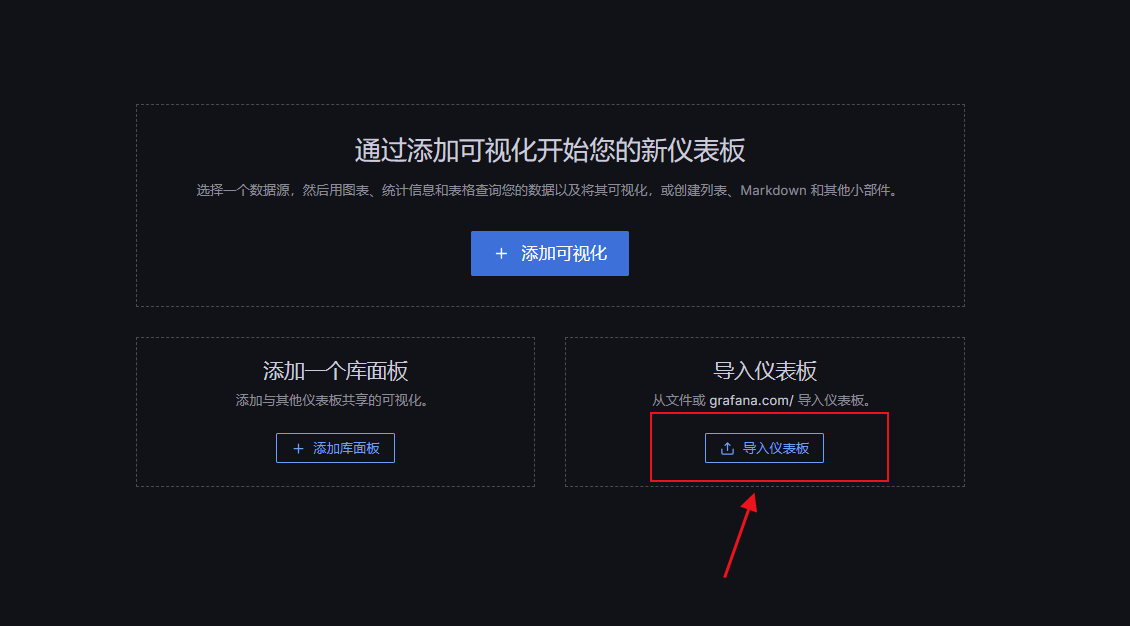
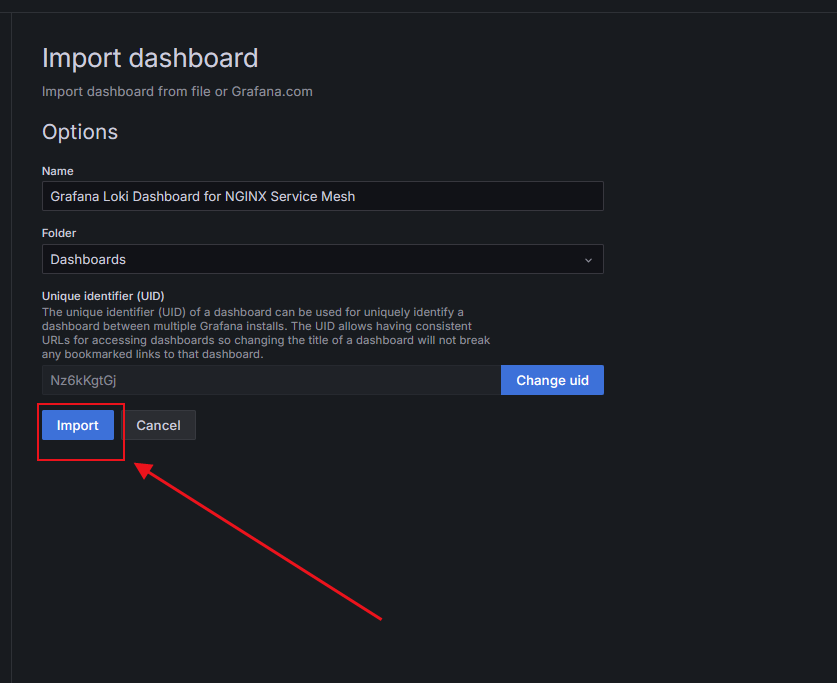
第五步导入监控模板
打开grafana模板官网(我这边链接直接挂的我用的模板,如果想用其他的可以自行配置):Loki NGINX Service Mesh - JSON version | Grafana Labs
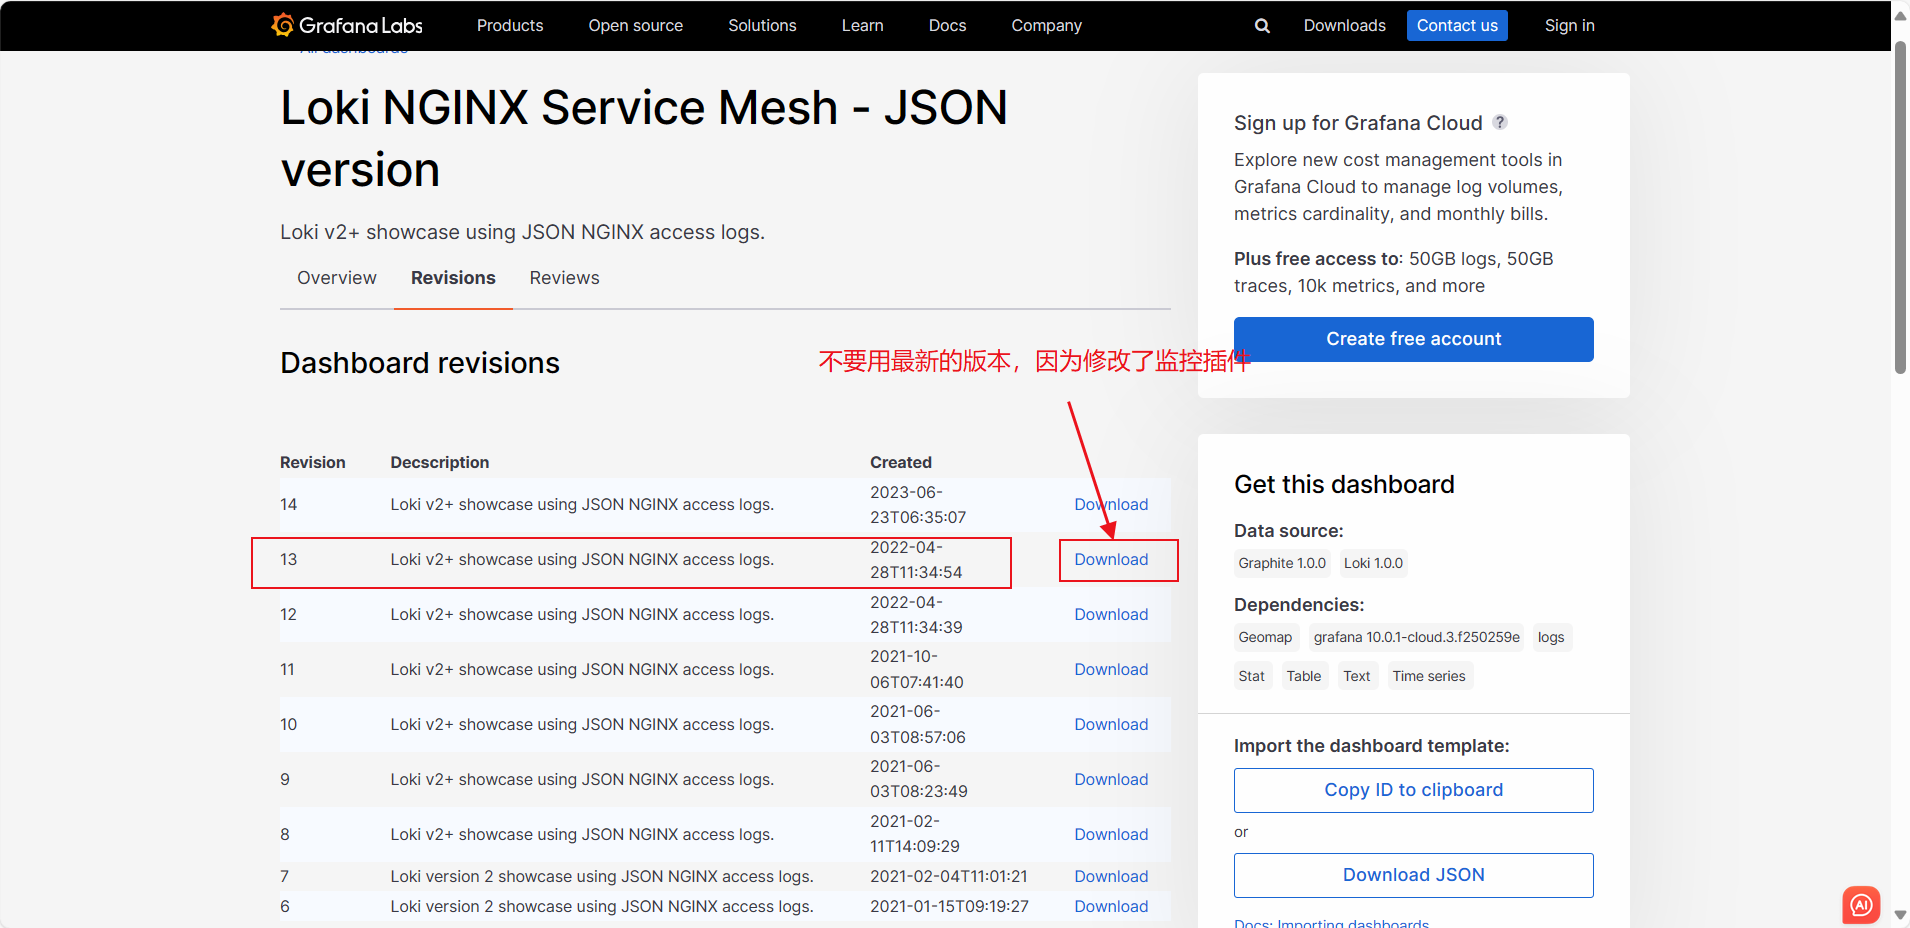
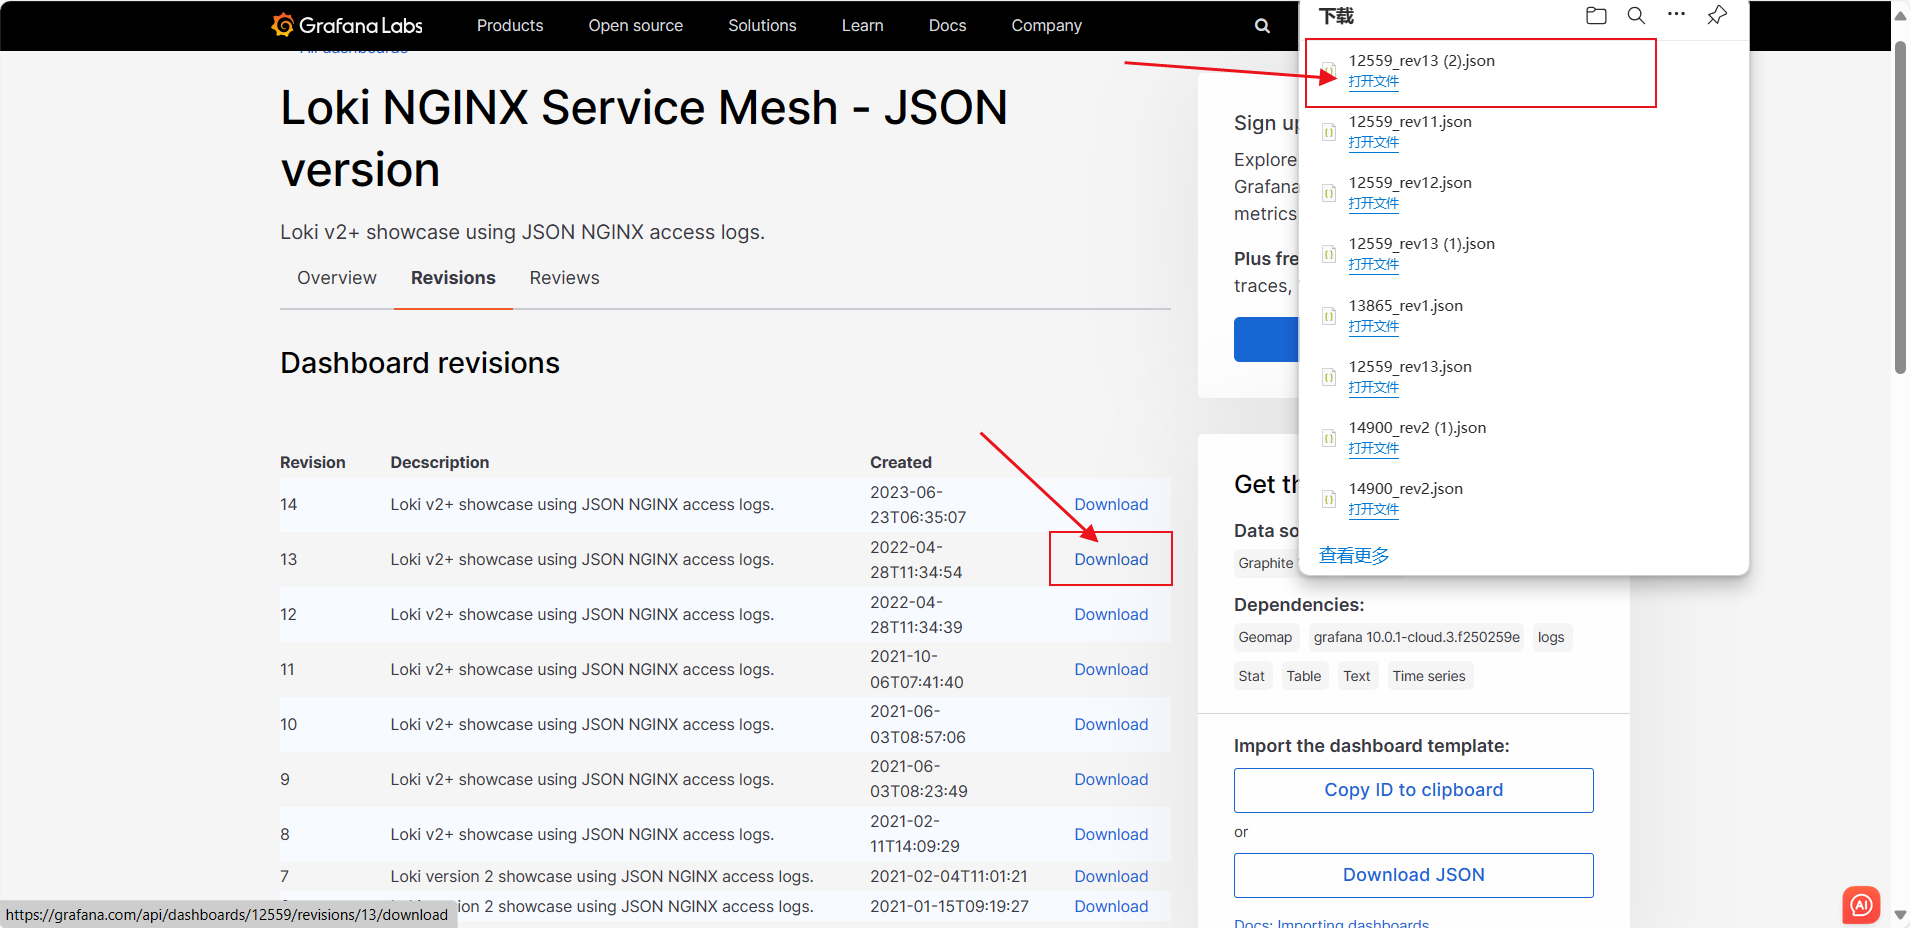
下载好模板之后回到grafana


 1835
1835


 被折叠的 条评论
为什么被折叠?
被折叠的 条评论
为什么被折叠?
 到【灌水乐园】发言


