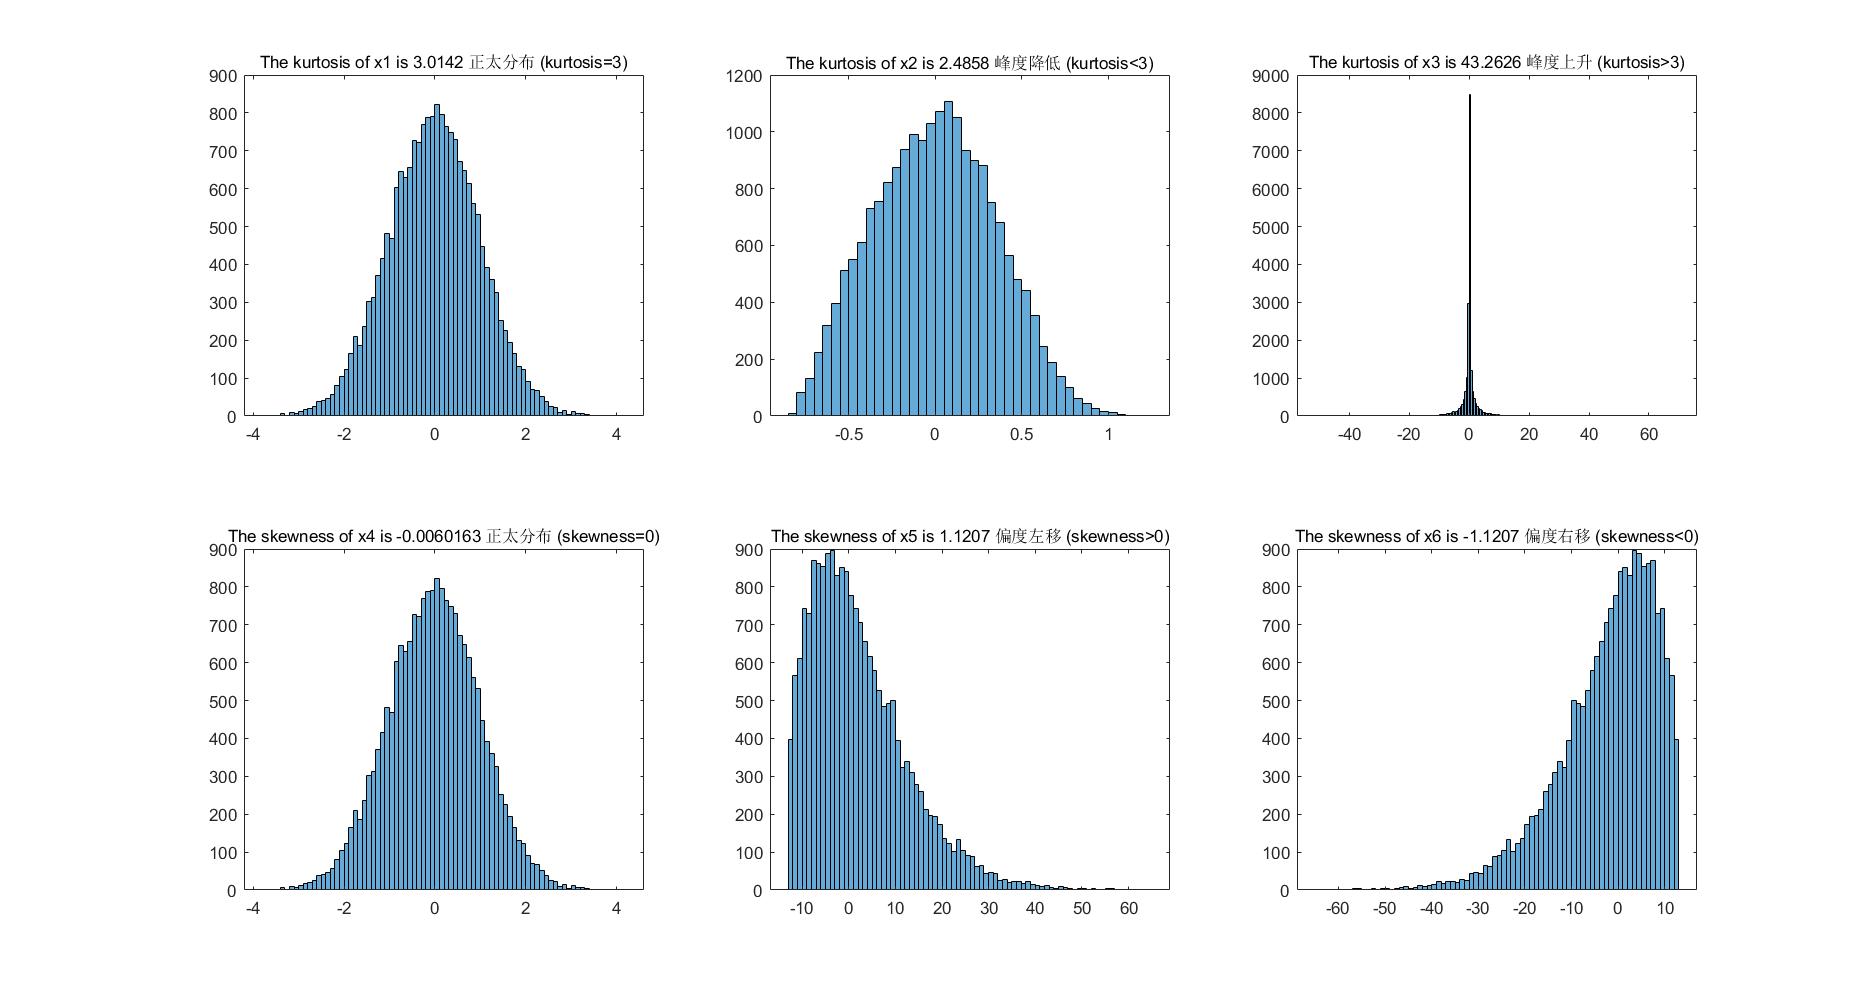
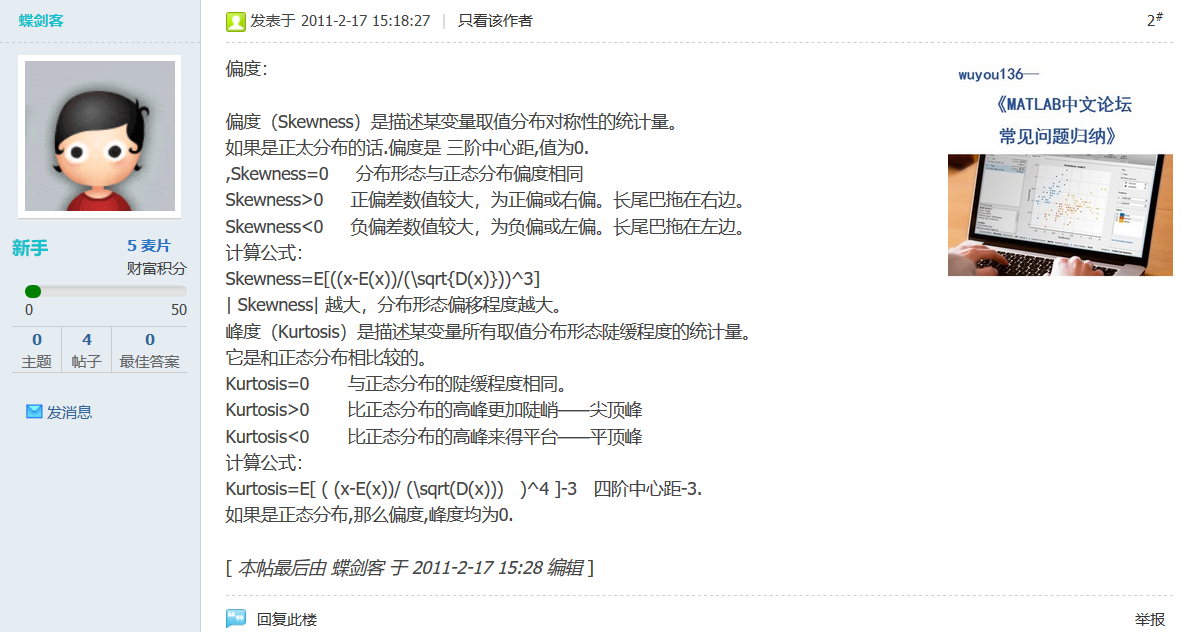
峰度kurtosis:用于度量x偏离某分布的程度。
- 正太分布的峰度是3;
- 当时间序列的曲线峰值比正太分布的高时,峰度大于3;
- 当比正太分布的低时,峰度小于3。
偏度skewness:用于衡量x的对称性。
- 对于正太分布,偏度为0;
- 若偏度为正,则x均值左侧的离散度比右侧弱;
- 若偏度为负,则x均值左侧的离散度比右侧强。
h = figure()
set(h,'position',[50 50 1500 800]);

x1 = randn(1,20000);
subplot(231)
histogram(x1)
title(['The kurtosis of x1 is ',num2str(kurtosis(x1)),' 正太分布 (kurtosis=3)'],'Fontsize',10)


subplot(232)
x2 = sqrt(abs(x1))-mean(sqrt(abs(x1)));
histogram(x2)
title(['The kurtosis of x2 is ',num2str(kurtosis(x2)),' 峰度降低 (kurtosis<3)'],'Fontsize',10)


subplot(233)
x3 = x1.^3 - mean(x1.^3);
histogram(x3)
title(['The kurtosis of x3 is ',num2str(kurtosis(x3)),' 峰度上升 (kurtosis>3)'],'Fontsize',10)


subplot(234)
x4 = x1;
histogram(x4)
title(['The skewness of x4 is ',num2str(skewness(x4)),' 正太分布 (skewness=0)'],'Fontsize',10)

subplot(235)
m = -10 + 2*x1; % mean = -1 ; std = 2
x5 = x1.*m;
histogram(x5)
title(['The skewness of x5 is ',num2str(skewness(x5)),' 偏度左移 (skewness>0)'],'Fontsize',10)

subplot(236)

x6 = -x5
histogram(x6)
title(['The skewness of x6 is ',num2str(skewness(x6)),' 偏度右移 (skewness<0)'],'Fontsize',10)
正态分布的偏度系数和峰度系数


 84
84

 被折叠的 条评论
为什么被折叠?
被折叠的 条评论
为什么被折叠?
 到【灌水乐园】发言


