


说在前面
- char.js版本:2.9.3
- 浏览器:google chrome 80.0.3987.132
- 主要参考:chartjs(不要去中文站,版本不对)
- 上一篇:【前端/chart.js】各种属性记录(一/多图预警)
测试用代码
html
(我将canvas放在了一个div中)<canvas id="testCanvas" width="80%" height="20%"></canvas>javasript<script src="static/js/Chart.js"></script> <script type="text/javascript"> var ctx = document.getElementById("testCanvas").getContext("2d"); var data = { type: "line", data: { labels: ["1", "2", "3", "4", "5", "6", "7"], datasets: [{ label: "data1", data: [20, 59, 80, 81, 56, 56, 40] } ] }, options: { responsiveAnimationDuration: 5000 } }; //创建 var myLineChart = new Chart(ctx, data); </script>
Configuration
-
动画(Animations)
- 属性
名称 数据类型 默认值 说明 duration number 1000 动画持续时间 easing string 'easeOutQuart' 指定动画在不同点上的行进速度,详见jQuery UI API - Easings onProgress function null 动画持续过程中调用的函数 onComplete function null 动画完成时调用的函数 - 全局访问
如Chart.defaults.global.animation.duration = 5000 - options访问
options: {
	animation: {
    	duration: 1000,
    	onComplete: function(){
			alert("animation finished!");
		}
    }
}
easing
见easings、Robert Penner’s easing equations、jQuery UI API - Easings
    var easing_type = ['linear', 'easeInQuad', 'easeOutQuad', 'easeInOutQuad',
        'easeInCubic', 'easeOutCubic', 'easeInOutCubic', 'easeInQuart',
        'easeOutQuart', 'easeInOutQuart', 'easeInQuint', 'easeOutQuint',
        'easeInOutQuint', 'easeInSine', 'easeOutSine', 'easeInOutSine',
        'easeInExpo', 'easeOutExpo', 'easeInOutExpo', 'easeInCirc',
        'easeOutCirc', 'easeInOutCirc', 'easeInElastic', 'easeOutElastic',
        'easeInOutElastic', 'easeInBack', 'easeOutBack', 'easeInOutBack',
        'easeInBounce', 'easeOutBounce', 'easeInOutBounce' ];
    var i = 0;
    setInterval(function () {
        i = (i) % easing_type.length;
        console.log(i);
        myLineChart.data.datasets[0].label = easing_type[i];
        myLineChart.data.datasets[0].data.splice(0, 1);
        myLineChart.data.datasets[0].data.push(parseInt(Math.random() * 50) + 20);
        myLineChart.update({
            easing: easing_type[i]
        });
        i = i + 1;
    }, 1500);*/
- 属性
-
布局(Layout)
- 属性
名称 数据类型 默认值 说明 padding number|object 0 chart与canvas之间的间隔 - 全局访问
如Chart.defaults.global.layout.padding = 10 - options访问
options: {
	padding: {
    	top: 10
	}
}
- 属性
-
图例(Legend)
-
全局访问
如Chart.defaults.global.legend.display = false -
options访问
如options: { legend: { display: false } } -
属性
名称 数据类型 默认值 说明 display boolean true 是否显示图例 设置为
false时可以看到dataset的label不显示了
名称 数据类型 默认值 说明 position string 'top' 图例的位置, top, bottom, right, left position为right时

名称 数据类型 默认值 说明 align string 'center' 图例在行或列中的位置, start, center, end position为top、align为start时
名称 数据类型 默认值 说明 fullWidth boolean true 图例是否需要占据整个canvas的宽度 fullWidth这个属性好似乎没啥用,用了下,感jio没啥区别名称 数据类型 默认值 说明 onClick function 点击标签时调用的函数 onHover function 光标进入标签时调用的函数 onLeave function 光标离开标签时调用的函数 // <h1 id='TitleID'>ChartJS TEST</h1> options: { legend: { onClick: function(){document.getElementById('TitleID').innerHTML="Click Item";}, onHover: function(){document.getElementById('TitleID').innerHTML="In Item";}, onLeave: function(){document.getElementById('TitleID').innerHTML="Out Item";} } }
名称 数据类型 默认值 说明 reverse boolean false labels反序 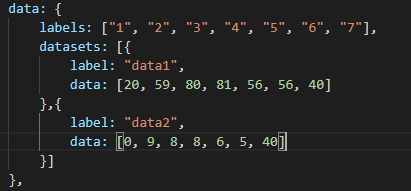
reverse为true时

名称 数据类型 默认值 说明 rtl boolean 从右向左生成标签 和
reverse效果差不多,rtl为true时

名称 数据类型 默认值 说明 labels object 图例中的标签对象 options: { legend: { labels: { boxWidth: 100, # label旁边小方框的宽度 fontSize: 16, # label字体大小 fontStyle: , # label字体风格 fontFamily: , # label字体样式 padding: , # label小方框间隔 generateLabels: , filter: , usePointStyle: , fontColor: 'rgb(255, 99, 132)' } } } -
东西太多,写起来有点卡,,,这部分其他就详见官网
-
-
太卡了,拆开来吧


 1069
1069


 被折叠的 条评论
为什么被折叠?
被折叠的 条评论
为什么被折叠?
 到【灌水乐园】发言


