#coding=gbk
import math
import matplotlib.pyplot as plt
import numpy as np
if __name__=="__main__":
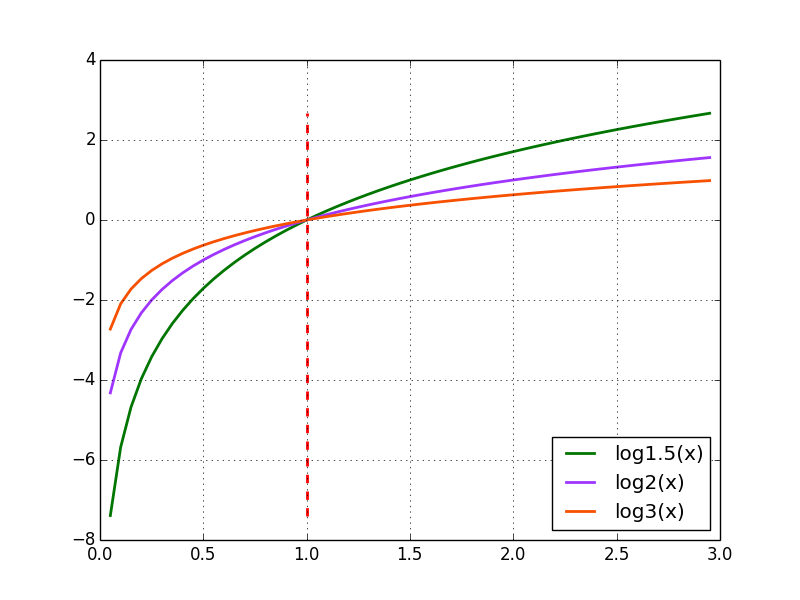
x = np.arange(0.05, 3, 0.05)
y1 = [math.log(a, 1.5) for a in x]
plt.plot(x, y1, linewidth=2, color='#007500', label='log1.5(x)')
plt.plot([1, 1], [y1[0], y1[-1]], "r--", linewidth=2)
'''
画一条线
r--是虚线 r-是实线
'''
y2 = [math.log(a, 2) for a in x]
plt.plot(x, y2, linewidth=2, color='#9F35FF', label='log2(x)')
y3 = [math.log(a, 3) for a in x]
plt.plot(x, y3, linewidth=2, color='#F75000', label='log3(x)')
plt.legend(loc=4)
'''
显示图例的地方
'best' : 0, (only implemented for axes legends)(自适应方式)
'upper right' : 1,
'upper left' : 2,
'lower left' : 3,
'lower right' : 4,
'right' : 5,
'center left' : 6,
'center right' : 7,
'lower center' : 8,
'upper center' : 9,
'center' : 10,
'''
plt.grid(True)
'''
显示网格(grid)
'''
plt.show()


 446
446


 被折叠的 条评论
为什么被折叠?
被折叠的 条评论
为什么被折叠?
 到【灌水乐园】发言


