| 四.代码 kNN算法 # kNN算法
import cv2
import numpy as np
import matplotlib.pyplot as plt
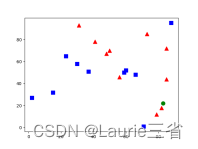
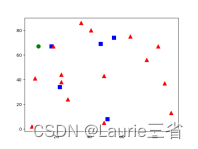
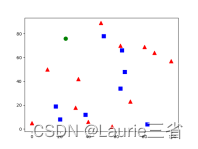
points = np.random.randint(0, 100, (20, 2)) # 随机选择20个点
labels = np.random.randint(0, 2, (20, 1)) # 为随机点随机分配标志
label0s = points[labels.ravel() == 0] # 分出标志为0的点
plt.scatter(label0s[:, 0], label0s[:, 1], 80, 'b', 's') # 将标志为0的点绘制为蓝色矩形
label1s = points[labels.ravel() == 1] # 分出标志为1的点
plt.scatter(label1s[:, 0], label1s[:, 1], 80, 'r', '^') # 将标志为1的点绘制为红色三角形
newpoint = np.random.randint(0, 100, (1, 2)) # 随机选择一个点,下面确定其分类
plt.scatter(newpoint[:, 0], newpoint[:, 1], 80, 'g', 'o') # 将待分类新点绘制为绿色圆点
plt.show()
# 进一步,使用kNN算法确认待分类新点的类别、3个最近邻居和与邻居的距离。
knn = cv2.ml.KNearest_create() # 创建kNN分类器
knn.train(points.astype(np.float32), cv2.ml.ROW_SAMPLE, labels.astype(np.float32)) # 训练模型
ret, results, neighbours, dist = knn.findNearest(newpoint.astype(np.float32), 3) # 找出3个最近邻居
print("新点标志: %s" % results)
print("邻居: %s" % neighbours)
print("距离:%s" % dist)
kNN识别手写数字 # kNN识别手写数字
import cv2
import numpy as np
import matplotlib.pyplot as plt
gray = cv2.imread('digits.png', 0) # 读入手写数字的灰度图像
digits = [np.hsplit(r, 100) for r in np.vsplit(gray, 50)] # 分解数字:50行,100列
np_digits = np.array(digits) # 转换为Numpy数组
# 准备训练数据,转换为2维数组,每个图像400个像素,5000*400
train_data = np_digits.reshape(-1, 400).astype(np.float32)
k = np.arange(10)
train_labels = np.repeat(np.arange(10), 500)[:, np.newaxis] # 为训练定义标志
knn = cv2.ml.KNearest_create() # 创建kNN分类器
knn.train(train_data, cv2.ml.ROW_SAMPLE, train_labels) # 训练模型
# 用绘图工具创建的手写数字5图像(大小为20*20)进行测试
test = cv2.imread('d6.png', 0) # 打开用于测试的数字图像,大小为20*20
test_data = test.reshape(1, 400).astype(np.float32) # 转换为测试数据
ret, result, neighbours, dist = knn.findNearest(test_data, k=5) # 执行测试
print(result.ravel()) # 输出测试结果
print(neighbours.ravel())
# 用真手写数字9拍摄所得图像,转换为20*20进行测试
img2 = cv2.imread('d8.jpg', 0)
ret, img2 = cv2.threshold(img2, 150, 255, cv2.THRESH_BINARY_INV) # 反二值化阈值处理
test_data = img2.reshape(1, 400).astype(np.float32) # 转换为测试数据
ret, result, neighbours, dist = knn.findNearest(test_data, k=3) # 执行测试
print(result.ravel()) # 输出测试结果
print(neighbours.ravel())
SVM算法 # SVM算法
import cv2
import numpy as np
import matplotlib.pyplot as plt
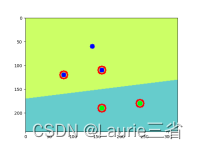
# 准备训练数据,假设图像高240,宽320,在其中选择5个点。
traindata = np.matrix([[110, 20], [50, 150], [30, 30], [110, 120], [210, 290]]
, dtype=np.float32)
# 5个点,前3个点为一类,标志为0;后2个点为一类,标志为1
labels = np.array([0, 0, 0, 1, 1])
svm = cv2.ml.SVM_create() # 创建SVM分类器
svm.setGamma(0.50625) # 设置相关参数
svm.setC(12.5)
svm.setKernel(cv2.ml.SVM_LINEAR)
svm.setType(cv2.ml.SVM_C_SVC)
svm.setTermCriteria((cv2.TERM_CRITERIA_MAX_ITER, 100, 1e-6))
svm.train(traindata, cv2.ml.ROW_SAMPLE, labels) # 训练模型
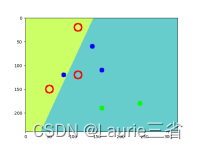
img = np.zeros((240, 320, 3), dtype="uint8") # 创建图像,用于SVM分类
colors = {0: (102, 255, 204), 1: (204, 204, 102)}
# 用SVM分类器对图像像素分类,根据结果设置像素颜色
for i in range(240):
for j in range(320):
point = np.matrix([[j, i]], dtype=np.float32) # 将像素坐标转换为测试数据
label = svm.predict(point)[1].ravel() # 执行预测,返回结果
img[i, j] = colors[label[0]] # 根据预测结果,设置像素颜色
svm_vectors = svm.getUncompressedSupportVectors() # 获得SVM向量
for i in range(svm_vectors.shape[0]): # 在图像中绘制SVM向量(红色圆)
cv2.circle(img, (int(svm_vectors[i, 0]), int(svm_vectors[i, 1])), 8, (0, 0, 255), 2)
# 在图像中绘制训练数据点,类别标志0使用蓝色,类别标志1使用绿色
cv2.circle(img, (140, 60), 5, (255, 0, 0), -1)
cv2.circle(img, (80, 120), 5, (255, 0, 0), -1)
cv2.circle(img, (160, 110), 5, (255, 0, 0), -1)
cv2.circle(img, (160, 190), 5, (0, 255, 0), -1)
cv2.circle(img, (240, 180), 5, (0, 255, 0), -1)
img = cv2.cvtColor(img, cv2.COLOR_BGR2RGB) # 转换为RGB格式
plt.imshow(img)
plt.show() # 显示结果
SVM识别手写数字 # SVM识别手写数字
import cv2
import numpy as np
def hog(img): # 定义HOG描述符计算函数
hog = cv2.HOGDescriptor((20, 20), (8, 8), # 定义HOGDescriptor对象
(4, 4), (8, 8), 9, 1, -1, 0, 0.2, 1, 64, True)
hog_descriptor = hog.compute(img) # 计算HOG描述符
hog_descriptor = np.squeeze(hog_descriptor) # 转换为一维数组
return hog_descriptor # 返回HOG描述符,144位
img = cv2.imread('digits.png', 0)
digits = [np.hsplit(row, 100) for row in np.vsplit(img, 50)] # 分解图像,50行100列
labels = np.repeat(np.arange(10), 500)[:, np.newaxis] # 定义对应的标记
hogdata = [list(map(hog, row)) for row in digits] # 计算图像的HOG描述符
trainData = np.float32(hogdata).reshape(-1, 144) # 转换为测试数据
svm = cv2.ml.SVM_create() # 创建SVM分类器
# 设置相关参数
svm.setKernel(cv2.ml.SVM_LINEAR)
svm.setType(cv2.ml.SVM_C_SVC)
svm.setC(2.67)
svm.setGamma(5.383)
svm.train(trainData, cv2.ml.ROW_SAMPLE, labels) # 训练模型
# 用绘图工具创建的手写数字5图像(大小为20*20)进行测试
test = cv2.imread('d5.jpg', 0) # 打开图像
test_data = hog(test)
test_data = test_data.reshape(1, 144).astype(np.float32) # 转换为测试数据
result = svm.predict(test_data)[1]
print('识别结果:', np.squeeze(result))
# 用绘图工具创建的手写数字8图像(大小为20*20)进行测试
test = cv2.imread('d9.jpg', 0)
test_data = hog(test)
test_data = test_data.reshape(1, 144).astype(np.float32) # 转换为测试数据
result = svm.predict(test_data)[1]
print('识别结果:', np.squeeze(result))
K均值聚类算法 # K均值聚类算法
import cv2
import numpy as np
from matplotlib import pyplot as plt
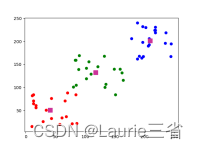
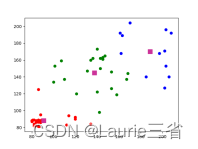
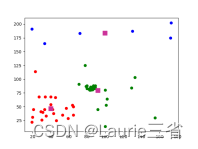
# 创建聚类数据,3种类别,每种类别20个点
data = np.vstack((np.random.randint(80, 90, (20, 2)),
np.random.randint(20, 70, (20, 2)),
np.random.randint(10, 210, (20, 2))))
data = data.astype(np.float32)
# 定义算法终止条件
criteria = (cv2.TERM_CRITERIA_EPS + cv2.TERM_CRITERIA_MAX_ITER, 20, 1.0)
# 使用K均值聚类算法执行分类操作,K=3,返回结果中label保存标志,center保存质心
ret, label, center = cv2.kmeans(data, 3, None, criteria, 10, cv2.KMEANS_RANDOM_CENTERS)
# 根据运算结果返回的标志,将数据分为3组,便于绘制图像
data1 = data[label.ravel() == 0]
data2 = data[label.ravel() == 1]
data3 = data[label.ravel() == 2]
plt.scatter(data1[:, 0], data1[:, 1], c='r') # 绘制第1类数据点,红色
plt.scatter(data2[:, 0], data2[:, 1], c='g') # 绘制第2类数据点,绿色
plt.scatter(data3[:, 0], data3[:, 1], c='b') # 绘制第3类数据点,蓝色
plt.scatter(center[:, 0], center[:, 1], 100, ['#CC3399'], 's') # 绘制质心,颜色为#CC3399
plt.show() # 显示结果
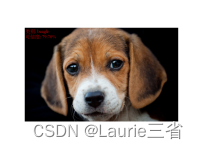
使用基于AlexNet和Caffe模型的图像识别 # 使用基于AlexNet和Caffe模型的图像识别
import cv2
import numpy as np
from matplotlib import pyplot as plt
from PIL import ImageFont, ImageDraw, Image
# 读入文本文件中的类别名称,共1000种类别,每行为一个类别,第11个字符开始为名称
# 基本格式如下。
# n01440764 tench, Tinca tinca
# n01443537 goldfish, Carassius auratus
# ……
file = open('classes.txt')
names = [r.strip() for r in file.readlines()]
file.close()
classes = [r[10:] for r in names] # 获取每个类别的名称
# 从文件中载入Caffe模型
net = cv2.dnn.readNetFromCaffe("AlexNet_deploy.txt", "AlexNet_CaffeModel.dat")
image = cv2.imread("dog.jpeg") # 打开图像,用于识别分类
# 创建图像blob数据,大小(224,224),颜色通道的均值缩减比例因子(104, 117, 123)
blob = cv2.dnn.blobFromImage(image, 1, (224, 224), (104, 117, 123))
net.setInput(blob) # 将图像blob数据作为神经网络输入
# 执行预测,返回结果是一个1×1000的数组,按顺序对应1000种类别的可信度
result = net.forward()
ptime, x = net.getPerfProfile() # 获得完成预测时间
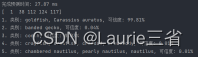
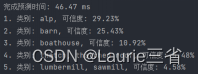
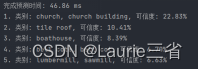
print('完成预测时间: %.2f ms' % (ptime * 1000.0 / cv2.getTickFrequency()))
sorted_ret = np.argsort(result[0]) # 将预测结果按可信度高低排序
top5 = sorted_ret[::-1][:5] # 获得排名前5的预测结果
print(top5)
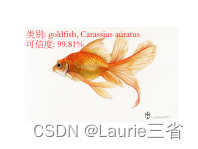
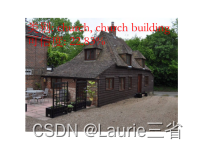
ctext = "类别: " + classes[top5[0]]
ptext = "可信度: {:.2%}".format(result[0][top5[0]])
# 输出排名前5的预测结果
for (index, idx) in enumerate(top5):
print("{}. 类别: {}, 可信度: {:.2%}".format(index + 1, classes[idx], result[0][idx]))
# 在图像中输出排名第1的预测结果
fontpath = "STSONG.TTF"
font = ImageFont.truetype(fontpath, 80) # 载入中文字体,设置字号
img_pil = Image.fromarray(image)
draw = ImageDraw.Draw(img_pil)
draw.text((10, 10), ctext, font=font, fill=(0, 0, 255)) # 绘制文字
draw.text((10, 100), ptext, font=font, fill=(0, 0, 255))
img = np.array(img_pil)
img = cv2.cvtColor(img, cv2.COLOR_BGR2RGB)
plt.imshow(img)
plt.axis('off')
plt.show() # 显示图像
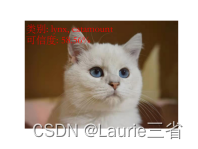
使用基于ResNet和Caffe模型的图像识别 # 使用基于ResNet和Caffe模型的图像识别
import cv2
import numpy as np
from matplotlib import pyplot as plt
from PIL import ImageFont, ImageDraw, Image
# 读入文本文件中的类别名称,共1000种类别,每行为一个类别
file = open('classes.txt')
names = [r.strip() for r in file.readlines()]
file.close()
classes = [r[10:] for r in names] # 获取每个类别的名称
# 从文件中载入Caffe模型
net = cv2.dnn.readNetFromCaffe("ResNet-50-deploy.prototxt", "ResNet-50-model.caffemodel")
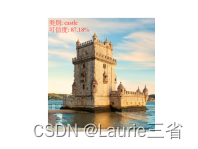
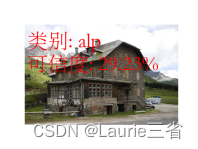
image = cv2.imread("woodHouse.jpeg") # 打开图像,用于识别分类
# 创建图像blob数据,大小(220,220),颜色通道的均值缩减比例因子(104, 117, 123)
blob = cv2.dnn.blobFromImage(image, 1, (220, 220), (104, 117, 123))
net.setInput(blob) # 将图像blob数据作为神经网络输入
result = net.forward() # 执行预测
ptime, x = net.getPerfProfile() # 获得完成预测时间
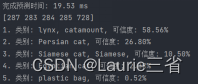
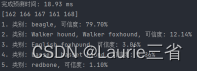
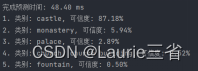
print('完成预测时间: %.2f ms' % (ptime * 1000.0 / cv2.getTickFrequency()))
sorted_ret = np.argsort(result[0]) # 将预测结果按可信度高低排序
top5 = sorted_ret[::-1][:5] # 获得排名前5的预测结果
ctext = "类别: " + classes[top5[0]]
ptext = "可信度: {:.2%}".format(result[0][top5[0]])
# 输出排名前5的预测结果
for (index, idx) in enumerate(top5):
print("{}. 类别: {}, 可信度: {:.2%}".format(index + 1, classes[idx], result[0][idx]))
# 在图像中输出排名第1的预测结果
fontpath = "STSONG.TTF"
font = ImageFont.truetype(fontpath, 80) # 载入字体,设置字号
img_pil = Image.fromarray(image)
draw = ImageDraw.Draw(img_pil)
draw.text((10, 10), ctext, font=font, fill=(0, 0, 255)) # 绘制文字
draw.text((10, 100), ptext, font=font, fill=(0, 0, 255))
img = np.array(img_pil)
img = cv2.cvtColor(img, cv2.COLOR_BGR2RGB)
plt.imshow(img)
plt.axis('off')
plt.show() # 显示图像
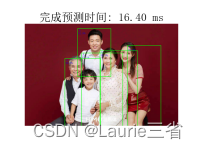
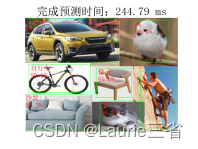
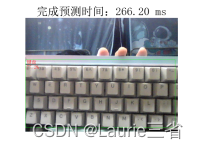
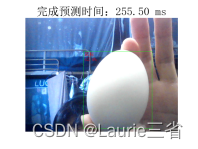
使用基于MobileNet_SSD和Caffe的预训练模型进行对象检测 # 使用基于MobileNet_SSD和Caffe的预训练模型进行对象检测
import cv2
import numpy as np
from matplotlib import pyplot as plt
import matplotlib
from PIL import ImageFont, ImageDraw, Image
# 加载字体,以便显示汉字
fontpath = "simsun.ttc"
font = ImageFont.truetype(fontpath, 20) # 载入字体,设置字号
font2 = {'family': 'simsun', "size": 22}
matplotlib.rc('font', **font2) # 设置plt字体
# 准备对象名称类别,设置为中文
object_names = ('背景', '飞机', '自行车', '鸟', '船', '瓶子', '公共汽车', '小汽车',
'猫', '椅子', '牛', '餐桌', '狗', '马', '摩托车',
'人', '盆栽', '羊', '沙发', '火车', '监视器')
mode = cv2.dnn.readNetFromCaffe("MobileNetSSD_deploy.txt", # 从文件加载Caffe模型
"MobileNetSSD_Caffemodel.dat")
image = cv2.imread("people.jpeg") # 打开用于对象检测的图像
blob = cv2.dnn.blobFromImage(image, 0.007843, (224, 224), # 创建图像的块数据
(120, 120, 127))
mode.setInput(blob) # 将块数据设置为模型输入
result = mode.forward() # 执行预测
ptime, x = mode.getPerfProfile() # 获得完成预测时间
title = '完成预测时间: %.2f ms' % (ptime * 1000.0 / cv2.getTickFrequency())
for i in range(result.shape[2]): # 处理检测结果
confidence = result[0, 0, i, 2] # 获得可信度
if confidence > 0.3: # 输出可信度大于30%的检测结果
a, id, a, x1, y1, x2, y2 = result[0, 0, i]
name_id = int(id) # 获得类别名称id
blob_size = 280
heightScale = image.shape[0] / blob_size # 计算原图像和图像块的高度比例
widthScale = image.shape[1] / blob_size # 计算原图像和图像块的宽度比例
# 计算检测出的对象的左下角和右上角坐标
x1 = int(x1 * blob_size * widthScale)
y1 = int(y1 * blob_size * heightScale)
x2 = int(x2 * blob_size * widthScale)
y2 = int(y2 * blob_size * heightScale)
cv2.rectangle(image, (x1, y1), (x2, y2), (0, 255, 0), 2) # 绘制标识对象的绿色矩形
# 在图像中输出对象名称和可信度
if name_id in range(len(object_names)):
text = object_names[name_id] + "\n{:.1%}".format(confidence)
img_pil = Image.fromarray(image)
draw = ImageDraw.Draw(img_pil)
draw.text((x1 + 5, y1), text, font=font, fill=(255, 0, 0)) # 绘制文字
image = np.array(img_pil)
img = cv2.cvtColor(image, cv2.COLOR_BGR2RGB)
plt.title(title)
plt.imshow(img)
plt.axis('off')
plt.show()
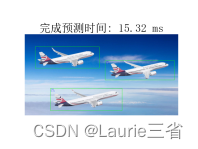
使用基于YOLO和Darknet的预训练模型进行对象检测 # 使用基于YOLO和Darknet的预训练模型进行对象检测
import cv2
import numpy as np
from matplotlib import pyplot as plt
import matplotlib
from PIL import ImageFont, ImageDraw, Image
# 加载字体,以便显示汉字
fontpath = "simsun.ttc"
font = ImageFont.truetype(fontpath, 20) # 载入字体,设置字号
font2 = {'family': 'simsun', "size": 22}
matplotlib.rc('font', **font2) # 设置plt字体
# 从文件中加载已知的对象名称
f = open("object_names.txt", encoding='utf-8') # 文件保存了80个类别的对象名称,每行一个
object_names = [r.strip() for r in f.readlines()]
f.close()
# 从文件中加载预训练的Darknet模型
mode = cv2.dnn.readNetFromDarknet("yolov3.cfg", "yolov3.weights")
image = cv2.imread("airplane.jpeg") # 打开图像文件
imgH, imgW = image.shape[:2]
out_layers = mode.getLayerNames() # 获得输出层
out_layers = [out_layers[i - 1] for i in mode.getUnconnectedOutLayers()]
blob = cv2.dnn.blobFromImage(image, 1 / 255.0, (416, 416), # 创建图像blob数据
swapRB=True, crop=False)
mode.setInput(blob) # 将图像blob数据设置为模型输入
layer_results = mode.forward(out_layers) # 执行预测,返回每层的预测结果
ptime, _ = mode.getPerfProfile()
tilte_text = '完成预测时间:%.2f ms' % (ptime * 1000 / cv2.getTickFrequency())
result_boxes = []
result_scores = []
result_name_id = []
for layer in layer_results: # 遍历所有输出层
for box in layer: # 遍历层的所有输出预测结果,每个结果为一个边框
# 预测结果结构:x, y, w, h, confidence,80个类别的概率
probs = box[5:]
class_id = np.argmax(probs) # 找到概率最大的类别id
prob = probs[class_id] # 找到最大的概率
if prob > 0.5: # 筛选出概率大于50%的
# 计算每个box在原图像中的的绝对坐标
box = box[0:4] * np.array([imgW, imgH, imgW, imgH])
(centerX, centerY, width, height) = box.astype("int")
x = int(centerX - (width / 2))
y = int(centerY - (height / 2))
result_boxes.append([x, y, int(width), int(height)])
result_scores.append(float(prob))
result_name_id.append(class_id)
# 应用非最大值抑制消除重复边界框,获得要绘制的box
draw_boxes = cv2.dnn.NMSBoxes(result_boxes, result_scores, 0.6, 0.3)
if len(draw_boxes) > 0:
for i in draw_boxes.ravel():
# 获得边框坐标
(x, y) = (result_boxes[i][0], result_boxes[i][1])
(w, h) = (result_boxes[i][2], result_boxes[i][3])
# 绘制边框
cv2.rectangle(image, (x, y), (x + w, y + h), (0, 255, 0), 1)
# 输出类别名称和可信度
text = object_names[result_name_id[i]] + \
"\n{:.1%}".format(result_scores[i])
img_pil = Image.fromarray(image)
draw = ImageDraw.Draw(img_pil)
draw.text((x + 5, y), text, font=font, fill=(0, 0, 255)) # 绘制文字
image = np.array(img_pil)
img = cv2.cvtColor(image, cv2.COLOR_BGR2RGB)
plt.title(tilte_text)
plt.imshow(img)
plt.axis('off')
plt.show()
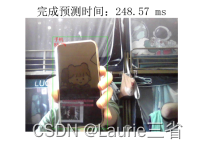
使用YOLO检测摄像头中的对象 # 实验3:使用YOLO检测摄像头中的对象
import cv2
import numpy as np
from matplotlib import pyplot as plt
import matplotlib
from PIL import ImageFont, ImageDraw, Image
# 加载字体,以便显示汉字
fontpath = "simsun.ttc"
font = ImageFont.truetype(fontpath, 20) # 载入字体,设置字号
font2 = {'family': 'simsun', "size": 22}
matplotlib.rc('font', **font2) # 设置plt字体
# 从文件中加载已知的对象名称,文件保存了80个类别的对象名称,每行一个
f = open("object_names.txt", encoding='utf-8')
object_names = [r.strip() for r in f.readlines()]
f.close()
# 从文件中加载预训练的Darknet模型
mode = cv2.dnn.readNetFromDarknet("yolov3.cfg", "yolov3.weights")
capture = cv2.VideoCapture(0) # 创建视频捕捉器对象
while True:
ret, image = capture.read() # 读摄像头的帧
if image is None:
break
imgH, imgW = image.shape[:2]
out_layers = mode.getLayerNames() # 获得输出层
out_layers = [out_layers[i - 1] for i in mode.getUnconnectedOutLayers()]
blob = cv2.dnn.blobFromImage(image, 1 / 255.0, (416, 416), # 创建图像blob数据
swapRB=True, crop=False)
mode.setInput(blob) # 将图像blob数据设置为模型输入
layer_results = mode.forward(out_layers) # 执行预测,返回每层的预测结果
ptime, _ = mode.getPerfProfile()
tilte_text = '完成预测时间:%.2f ms' % (ptime * 1000 / cv2.getTickFrequency())
result_boxes = []
result_scores = []
result_name_id = []
for layer in layer_results: # 遍历所有输出层
for box in layer: # 遍历层的所有输出预测结果,每个结果为一个边框
# 预测结果结构:x, y, w, h, confidence,80个类别的概率
probs = box[5:]
class_id = np.argmax(probs) # 找到概率最大的类别id
prob = probs[class_id] # 找到最大的概率
if prob > 0.5: # 筛选出概率大于50%的
# 计算每个box在原图像中的的绝对坐标
box = box[0:4] * np.array([imgW, imgH, imgW, imgH])
(centerX, centerY, width, height) = box.astype("int")
x = int(centerX - (width / 2))
y = int(centerY - (height / 2))
result_boxes.append([x, y, int(width), int(height)])
result_scores.append(float(prob))
result_name_id.append(class_id)
# 应用非最大值抑制消除重复边界框,获得要绘制的box
draw_boxes = cv2.dnn.NMSBoxes(result_boxes, result_scores, 0.6, 0.3)
if len(draw_boxes) > 0:
for i in draw_boxes.ravel():
# 获得边框坐标
(x, y) = (result_boxes[i][0], result_boxes[i][1])
(w, h) = (result_boxes[i][2], result_boxes[i][3])
# 绘制边框
cv2.rectangle(image, (x, y), (x + w, y + h), (0, 255, 0), 1)
# 输出类别名称和可信度
text = object_names[result_name_id[i]] + \
"\n{:.1%}".format(result_scores[i])
img_pil = Image.fromarray(image)
draw = ImageDraw.Draw(img_pil)
draw.text((x + 5, y), text, font=font, fill=(0, 0, 255)) # 绘制文字
image = np.array(img_pil)
img = cv2.cvtColor(image, cv2.COLOR_BGR2RGB)
plt.title(tilte_text)
plt.imshow(img)
plt.axis('off')
plt.show()
量化图像颜色 # 实验内容1:量化图像颜色
import cv2
import numpy as np
img = cv2.imread('test1.jpg') # 打开图像
img2 = img.reshape((-1, 3)).astype(np.float32) # 转换为n*3的浮点类型数组
criteria = (cv2.TERM_CRITERIA_EPS +
cv2.TERM_CRITERIA_MAX_ITER, 10, 1.0) # 定义算法终止条件
def doChange(x):
K = cv2.getTrackbarPos('K', 'Main')
if K > 0:
ret, label, center = cv2.kmeans(img2, K, None,
criteria, 10, cv2.KMEANS_RANDOM_CENTERS) # 执行K均值聚类操作
center = np.uint8(center) # 将质心转换为整型
img3 = center[label.ravel()] # 转换为一维数组
img3 = img3.reshape((img.shape)) # 恢复为原图像数组形状
cv2.imshow('Changed', img3)
cv2.namedWindow('Main')
cv2.createTrackbar('K', 'Main', 0, 20, doChange) # 创建跟踪栏
while (True):
cv2.imshow('Main', img) # 显示图像
k = cv2.waitKey(1)
if k == 27: # 按【Esc】键时结束循环
break
cv2.destroyAllWindows()
# 实验内容1:量化图像颜色
import cv2
import numpy as np
img = cv2.imread('test1.jpg') # 打开图像
img2 = img.reshape((-1, 3)).astype(np.float32) # 转换为n*3的浮点类型数组
criteria = (cv2.TERM_CRITERIA_EPS +
cv2.TERM_CRITERIA_MAX_ITER, 10, 1.0) # 定义算法终止条件
def doChange(x):
K = cv2.getTrackbarPos('K', 'Main')
if K > 0:
ret, label, center = cv2.kmeans(img2, K, None,
criteria, 10, cv2.KMEANS_RANDOM_CENTERS) # 执行K均值聚类操作
center = np.uint8(center) # 将质心转换为整型
img3 = center[label.ravel()] # 转换为一维数组
img3 = img3.reshape((img.shape)) # 恢复为原图像数组形状
cv2.imshow('Changed', img3)
cv2.namedWindow('Main')
cv2.createTrackbar('K', 'Main', 0, 20, doChange) # 创建跟踪栏
while (True):
cv2.imshow('Main', img) # 显示图像
k = cv2.waitKey(1)
if k == 27: # 按【Esc】键时结束循环
break
cv2.destroyAllWindows()
使用K均值聚类算法量化颜色 # 使用K均值聚类算法量化颜色
import cv2
import numpy as np
img = cv2.imread('bee.jpg') # 打开图像
cv2.imshow('Original', img) # 显示原图
img2 = img.reshape((-1, 3)).astype(np.float32) # 转换为n*3的浮点类型数组
# 定义算法终止条件
criteria = (cv2.TERM_CRITERIA_EPS + cv2.TERM_CRITERIA_MAX_ITER, 10, 1.0)
K = 16
ret, label, center = cv2.kmeans(img2, K, None, criteria, 10, cv2.KMEANS_RANDOM_CENTERS)
center = np.uint8(center) # 将质心转换为整型
img3 = center[label.ravel()] # 转换为一维数组
img3 = img3.reshape((img.shape)) # 恢复为原图像数组形状
cv2.imshow('K=16', img3)
cv2.waitKey(0)
|


 3880
3880

 非常没帮助
非常没帮助
 没帮助
没帮助
 一般
一般
 有帮助
有帮助
 非常有帮助
非常有帮助
 被折叠的 条评论
为什么被折叠?
被折叠的 条评论
为什么被折叠?
 到【灌水乐园】发言


