


 博客介绍基于GEE计算标准化降水指数(SPI)的脚本。SPI描述降水量与正常降水量偏离概率,脚本基于1981年以来每日CHIRPS数据计算每月SPI,还包含与MODIS获取日期匹配的16天SPI产品计算,给出代码链接及完整代码,所得SPI值仅作估计器。
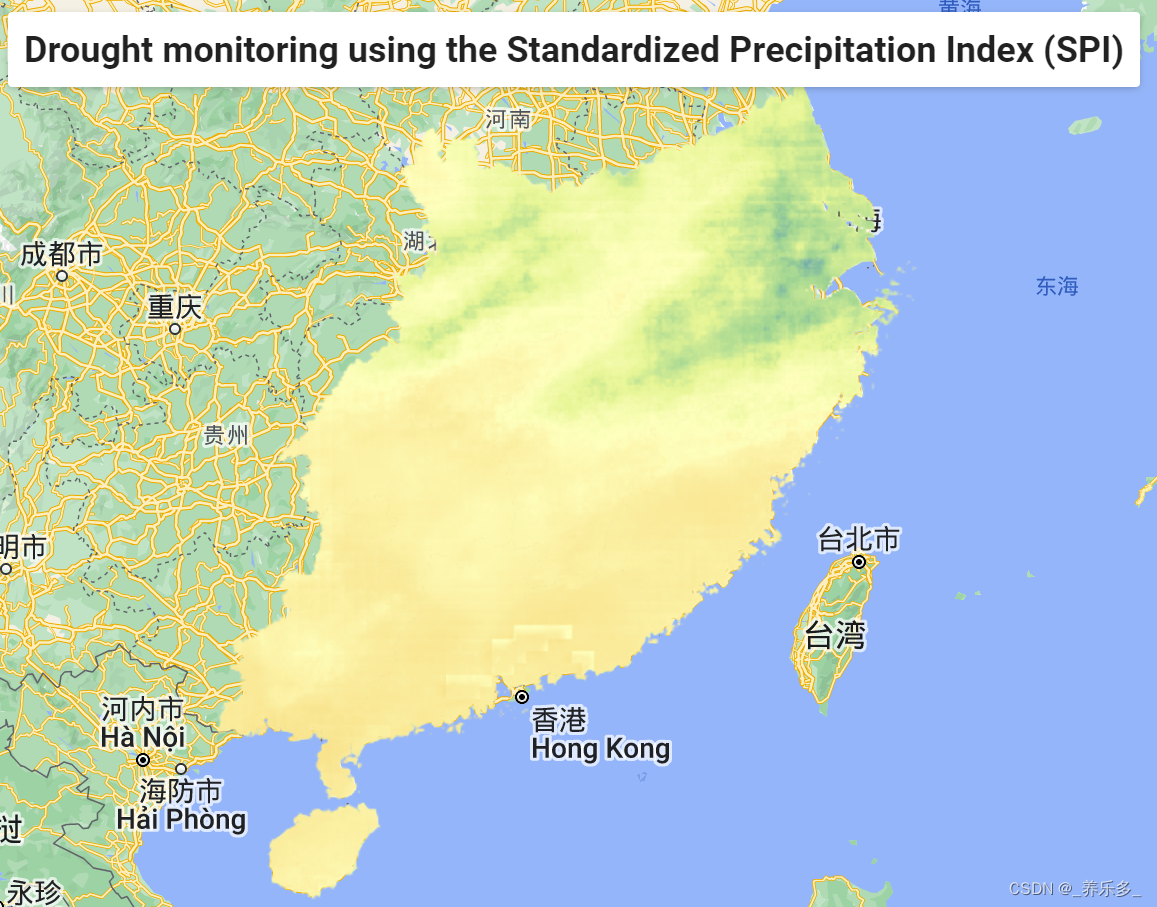
标准化降水指数( STANDARDIZED PRECIPITATION INDEX,SPI)由McKee等人(1993年)开发,描述了多年数据中降水量与正常降水量的偏离概率,以月度(或多月)为时间步长。 SPI的计算是通过在第k年的时间段j内获取像素i的降水减去n年内时间段j内像素i的平均值,然后除以n年内时间段j内像素i的标准差来完成的。在此脚本中,将基于自1981年以来的每日CHIRPS数据计算每月SPI,这将被累加到月度(或多月的)降水数据。此外,此脚本包含与MODIS(MOD13Q1.006)获取日期相匹配的16天SPI产品的计算(如果用户未应用“shift”)。由于降水通常不服从正态分布,因此通常使用伽马概率函数,但该脚本不支持。因此,所得到的SPI值仅可用作估计器。
一、代码链接
https://code.earthengine.google.com/a1dd9e6d96ffd7b9dcdae00bdb24c547?noload=true
二、完整代码
//=====================================================================================================
//                      DROUGHT MONITORING USING THE STANDARDIZED PRECIPITATION INDEX (SPI)
//=====================================================================================================
//The Standardized Precipitation Index (SPI) developed by McKee et al. (1993) describes the probability
//of variation from the normal precipitation over multiple years of data, on a monthly (or multiple months)
//time step. The SPI is calculated by taking the precipitation of the pixel i during timeframe j of year k
//minus the mean of pixel i during timeframe j over n years,
//divided by standard deviation of pixel i during timeframe j over n years.
//Within this script, the monthly SPI will be calculated based on daily CHIRPS data (since 1981) which
//will be summed up to monthly (or several months of) precipitation data. Furthermore, this script
//contains a calculation for 16-day SPI products which dates match with the MODIS (MOD13Q1.006) acquisition
//dates (if the user does not apply a 'shift').
//As precipitation is usually not normaly distributed, a gamma probability function is commonly used,
//but not supported in that script. The resulting SPI values can therefore just be used as an estimator.
//=====================================================================================================

//:::::::::::::::::::::::::::::::::::::::::::::::::::::::::::::::::::::::::::::::::::::::::::
//                                    RUN A DEMO (optional)

// If you would like to run an example of mapping the SPI you can use the predefined
// geometry below as well as the other predefined parameter settings. The code will take you
// to Cape Winelands, South Africa. Large parts of South Africa experience a drought since 2018.
// --> Remove the comment-symbol (//) below to so Earth Engine recognizes the polygon.

//var AOI = ee.FeatureCollection(ee.Geometry.Polygon([[[20.166490002611528,-32.227069997682158],[20.240840003063745,-32.224189996171376],[20.254169998146956,-32.310849998628534],[20.216030004681087,-32.303159994737975],[20.1635200041449,-32.351020005668623],[20.170450001766163,-32.380869997252553],[20.13202000122212,-32.421120002586051],[20.079640001285107,-32.397309999057157],[20.141190002316847,-32.643739995804182],[20.191719999678284,-32.685760000023983],[20.187609997203662,-32.752670002718411],[20.219040003193658,-32.784739995054636],[20.29989999628781,-32.804959999404353],[20.357169993300619,-32.864079998093459],[20.363879998762993,-32.910810003678719],[20.380049998908348,-32.901849999677751],[20.438599994694087,-32.940060003566231],[20.434680000081975,-32.971920003305456],[20.394960003001852,-32.993239993630723],[20.383750003160131,-33.036279999921952],[20.334260001597862,-33.035789999808664],[20.302549998883393,-33.067999993205056],[20.279050000656998,-33.063889998824315],[20.318490001012737,-33.120889995976526],[20.306440000205875,-33.15933999924156],[20.25124999569077,-33.14990999694875],[20.202179999107742,-33.170109997678189],[20.257969998916384,-33.188449990874304],[20.235620001561852,-33.262419997185035],[20.251180000556637,-33.291510001385362],[20.203509999287064,-33.302739996753388],[20.23945999698136,-33.309919988816333],[20.209170001294588,-33.379799997172078],[20.368039999046708,-33.366270000060418],[20.335609990108974,-33.425640001284997],[20.389790000208421,-33.424049999907503],[20.427549998633612,-33.448919998359166],[20.336220000252883,-33.487819990899816],[20.498019997325059,-33.463870003397894],[20.50166000420586,-33.498459997730706],[20.475629999025305,-33.513439997857532],[20.478199998830895,-33.52778000084632],[20.577130002347779,-33.528099999415389],[20.503149999173178,-33.637019998673935],[20.535171997389792,-33.660713002203273],[20.503942999769656,-33.682042001936779],[20.469152004261584,-33.681952002283005],[20.472820999889255,-33.729168997051552],[20.447889998624571,-33.773970001814092],[20.514470003188137,-33.802619998314277],[20.480499999675342,-33.822760001672648],[20.450180001705778,-33.806819998643938],[20.42662999667704,-33.810949998443597],[20.469909999646799,-33.889699995858059],[20.436040003443459,-33.957740008394637],[20.324429999744734,-33.949570003053132],[20.234370004172344,-33.897860003436413],[20.222460001727807,-33.912819998144322],[20.258390002996254,-33.941730003037186],[20.328019999823191,-33.973050003954491],[20.307140001909588,-34.029369995828567],[20.279189999918604,-34.039580000816343],[20.298879996914401,-34.060329999030138],[20.286149999822658,-34.078899998336233],[20.305659996611627,-34.077280002769918],[20.270130003896572,-34.090159996886328],[20.272660002757029,-34.106159997286028],[20.249670001969136,-34.106119996340716],[20.246759999074751,-34.117260001048216],[20.221800000969317,-34.11110000925796],[20.229969998216937,-34.095199999979954],[20.203140002009537,-34.088429998045882],[20.187280000871358,-34.102000004196825],[20.137610000900821,-34.082359997815608],[20.202170001344502,-34.078560004240778],[20.196090003350989,-34.039999996802329],[20.177809999431975,-34.02983000085375],[20.14169000019346,-34.059210001340439],[20.008499997776699,-34.063900009877528],[20.007460001977531,-34.093919999408378],[19.986540003118705,-34.078170002443613],[19.755219997205156,-34.054410003918505],[19.734980002725003,-34.041160004430594],[19.700139996863378,-34.046400002358162],[19.680660002357289,-34.0091400009103],[19.589830000054523,-34.012360002811775],[19.533299997596856,-33.969529999909533],[19.455799997571901,-33.999880000161887],[19.426739995654277,-33.993179994261226],[19.325050003355074,-33.952079998293229],[19.297400002608114,-33.889680000331673],[19.278189998969289,-33.879455001846786],[19.258389997800254,-33.883110002224782],[19.265250000287296,-33.900290003980487],[19.243800000369784,-33.897449997119601],[19.206579999867149,-33.950410004018366],[19.190999997252092,-33.947220004399597],[19.164589988936889,-33.971420003430332],[19.145550002130943,-33.955950004089324],[19.126060000868364,-33.961720002176293],[18.987249997389569,-34.035240001224992],[18.927400002807929,-33.999939998432154],[18.885199996582649,-34.034070003927454],[18.855259994553133,-34.030930003017239],[18.861910001745244,-34.038269997961969],[18.841840001614887,-34.047110001825111],[18.818949998243831,-34.039710002314706],[18.809220002800966,-34.063389998049914],[18.766250007831633,-34.043709998817356],[18.742060000268815,-34.02128999913409],[18.751769999286097,-34.005320001916552],[18.728267237443077,-33.969302855442386],[18.743959003305413,-33.932208995648566],[18.708330000629061,-33.922690998290832],[18.717250995637016,-33.898472000182579],[18.751381002031689,-33.893539002023289],[18.752869999650848,-33.834419999783066],[18.79257000120467,-33.819210001640222],[18.784427532204909,-33.80378657459066],[18.809769999385953,-33.781330001278469],[18.787650998294961,-33.766682997622212],[18.810990002586639,-33.758789998759354],[18.809459998580127,-33.740780001895544],[18.832999997751745,-33.738170001144553],[18.821990000837932,-33.708300002343229],[18.794589996331304,-33.706830002902301],[18.793710003414013,-33.679429998395676],[18.821899993989557,-33.641790001906962],[18.787539996773475,-33.637630000723874],[18.818249995640837,-33.595189998719434],[18.83631000020636,-33.604409997623257],[18.83931000185515,-33.577630001023685],[18.892779997199163,-33.5715199998481],[18.899719999778178,-33.551069995683726],[18.938090001152677,-33.54599999930047],[18.938009999262054,-33.470070004227253],[18.954189989976136,-33.461949997594303],[18.955549999632851,-33.429909997648245],[18.970009998262885,-33.429919996310765],[18.978090003051243,-33.399570004152295],[18.992529988168474,-33.394109997878076],[18.978389997100756,-33.318450000866811],[18.997410002769513,-33.307630001923066],[18.950859999189642,-33.265509999386879],[18.957119997389984,-33.221760000823302],[18.931880001660797,-33.201070000879767],[18.980100000414726,-33.152110000376183],[19.05095000134154,-33.142040001844613],[19.089559997595831,-33.114070004327147],[19.172990000388282,-33.091920001806642],[19.177360003161617,-33.060010003358869],[19.153710000715954,-32.984039999246541],[19.186149992128534,-32.868160000083847],[19.171769996288315,-32.736820000242844],[19.208640004032976,-32.730960001602732],[19.142990000088503,-32.621439998057483],[19.137599997042301,-32.604599999390395],[19.156379998837927,-32.604320000867276],[19.148629997576386,-32.585520002645978],[19.159169998896378,-32.571930000968734],[19.26470000280294,-32.588720001826545],[19.320050002105951,-32.574640000035927],[19.341249998588619,-32.583050001156593],[19.356930000419251,-32.616360003910984],[19.396119997340058,-32.606660002656945],[19.441269996613133,-32.638109996978727],[19.486805002848698,-32.565439995759128],[19.52824999584071,-32.67323999822726],[19.604950000342328,-32.629459998280254],[19.621850003574906,-32.470620001012186],[19.654870000150407,-32.438780000396655],[19.679740001300086,-32.463509998687428],[19.730240001774682,-32.442360000013942],[19.707390001147676,-32.420309999406939],[19.731310000756011,-32.410129996701954],[19.73662000371024,-32.385520000347661],[19.764129995303151,-32.411120008181776],[19.80270000140403,-32.393700001653748],[19.817800009762657,-32.360719997030131],[19.873889994627561,-32.383200002178349],[19.937490002961347,-32.377279998073377],[20.038619999113763,-32.296440003203543],[20.053609999701763,-32.252310000605945],[20.096960003201605,-32.250239998676967],[20.13590999535009,-32.19231999776963],[20.180950001241651,-32.18448999821485],[20.166490002611528,-32.227069997682158],[20.166490002611528,-32.227069997682158]]]));

// Now hit Run to start the demo!
// Do not forget to delete/out comment this geometry before creating a new one!
//**************************************DISCLAIMER!****************************************************
//Please refer to the disclaimer at the end of the script!
//:::::::::::::::::::::::::::::::::::::::::::::::::::::::::::::::::::::::::::::::::::::::::::
//=====================================================================================================
//                             SELECT YOUR OWN STUDY AREA

// Use the polygon-tool in the top left corner of the map pane to draw the shape of your
// study area. Single clicks add vertices, double-clicking completes the polygon.
//*************************************CAUTION!**********************************************
//Afterwards, go to the setting of the polygon (gear-symbol within your 'Geometry Imports'),
//rename the polygon to 'AOI' and change the 'Import as' drop down to 'FeatureCollection'.
// **CAREFUL**: Under 'Geometry Imports' (top left in map panel) uncheck the
//              geometry box, so it does not block the view on the imagery later.

//**********************************Alternatively:*******************************************
//Upload your shapefile via the 'Assets' tab in the upper left corner. Select 'NEW' => 'Shape Files'
//and upload the four relevant files of your shapefile (.dbf, .prj, .shp, .shx). Once uploaded, refresh
//the assets and import your shapefile from the asset tab into this script by clicking the arrow symbol.
//Rename the imported asset to 'AOI' (Area of Interest).

//=====================================================================================================
//                                     SET TIME FRAME
//If you want to use another period of time than the whole time span of CHIRPS data, change the
//code between ee.Date brackets (start_date & end_date) to the desired dates.
//Keep in mind, that a reduction of the time span will lead to a less accurate SPI calculation.

var firstImage = ee.Date(ee.List(CHIRPS.get('date_range')).get(0));
var latestImage = ee.Date(CHIRPS.limit(1, 'system:time_start',  false).first().get('system:time_start'));

//                                 SET TIME FRAME FOR EXPORT
//As exporting all images over the whole investigation period might cause issues, a reduction of the
//images to be exported is advisable. You can change the start and end point for the export selection
//below. The images will be added to the 'Tasks' tab.

var exportdata = false; //set to 'true' if you wish to export images
var startDateForDownload = '2019-06-01';
var endDateForDownload = latestImage;

//=====================================================================================================
//                                     SET RESOLUTION
//CHIRPS datasets have a resolution of 0.05°. However, as GEE is using meter to define the resolution,
//you might have to recalculate the resolution for your AOI. According to

//https://www.usna.edu/Users/oceano/pguth/md_help/html/approx_equivalents.htm

//a resolution of 0.05° corresponds to approximately 5550 meters at the equator.
//Depending on the size of your AOI it might be useful to decrease the resolution to a certain extent
//(eg. 10000). This shortens the processing time. However, the defined resolution effects the statistic
//calculations (plotted charts) and the exported image, not the displayed image.

var resolution = 5550;

//=====================================================================================================
//                            SET TIME SCALE INFORMATION FOR SPI
//The SPI can be calculated based on different time scales. The scientific society usually recognizes
//one month as the shortest timescale for the calculation of the SPI. Shorter timescales might underly
//random  fluctuations in precipitation. However, the SPI can also be calculated for longer timescales,
//like 6 months. The following settings will give you the possibility to set your own time
//frame for the calculation of the SPI.

//!!!!!!!!!!!!!!!!!!!!!!!!!!!!!!!!!!!!!!!!!!!!DISCLAIMER!!!!!!!!!!!!!!!!!!!!!!!!!!!!!!!!!!!!!!!!!!!!!!
//The calculation works for the following quantity of months:
//1, 2, 3, 4, 5, 6, 7, 8, 9, 10, 11, 12, 24, 48
//!!!!!!!!!!!!!!!!!!!!!!!!!!!!!!!!!!!!!!!!!!!!!!!!!!!!!!!!!!!!!!!!!!!!!!!!!!!!!!!!!!!!!!!!!!!!!!!!!!!!

var timestep = '1'; //Choose the number of months for the SPI. The default setting will calculate the SPI
                    //for 1 month. Setting the timestep to '6' will calculate the SPI for 6 months.

//=====================================================================================================
//                            SET TIME SHIFT FOR MODIS RELATED SPI
//The 16-day SPI product is an additional product besides the 'normal' SPI and will be calculated for the
//same dates as MODIS's MOD13Q1.006 (NDVI and EVI) products. As the vegetation might need some time to
//respond to rainfall, it might be useful to apply a shift for the calculated 16-day SPI. For example:
//an applied shift of '-5' will cause the (16-day) SPI calculations to be started five days before the
//MODIS start dates and end the calculations five days earlier than the MODIS end dates as well. This
//feature might be useful when studying the response on vegetation towards rainfall. The variable "days"
//provides information about the observed days. As MODIS gives 16-Day products, the default value is
//set to 16. If you wish to increase the number of days anyway, you can change its value.

var shift = '0';
var days = '16';

//=====================================================================================================
//                                    INTERACTIVE CHART
//Show interactive chart when clicking on a pixel?
var showInteractiveChart = true; //set to "true" if you want to use the interactive chart. Otherwise set to "false"

//=====================================================================================================


//                                    START OF THE SCRIPT

//******************************************************************************************************************************
//MONTHLY SPI
var thresholdMonths = ee.Number(12)

  //Create a list with a lag of one month between each list entry. Started from latest image counting backwards
var timedif = (latestImage.difference(firstImage, 'month')).divide(ee.Number.parse(timestep));

  //Creates a simple list
var list = ee.List.sequence(0, timedif);

  //Map the dates (beginning with the latest image) of the months ends over the list, counting backwards in time
var timeListDate = list.map(function(month){
  var zero = ee.Number(0); //Is needed to substract month
  var delta = (zero.subtract(month)).multiply(ee.Number.parse(timestep)); //results in a negative counting in the list (from latest image backwards) in the steps provided by the user
  var latestDate = latestImage.advance(1, 'day');//Advance one day to include the latest image (starts counting at 00:00 o'clock)
  return latestDate.advance(delta, 'month');//returns a list of dates counted from latest date backwards
});

  //Sort list according to their dates
var sortedTimeList = timeListDate.sort();

  //Calculate summed CHIRPS. Just those images will be kept, whose timeframe corrensponse to the user provided number of months
var PrecipitationSum = ee.ImageCollection.fromImages(timeListDate.map(function(monthly_sum){
  var startTime = ee.Date(monthly_sum).advance(ee.Number.parse(timestep).multiply(-1), 'month');
  var endTime = ee.Date(monthly_sum);
  var filteredCHIRPS = CHIRPS.filterDate(startTime, endTime);
  var clippedCHIRPS = filteredCHIRPS.map(function(clip){return clip.clip(AOI)});
  var imageAmount = clippedCHIRPS.size();
  var summedCollection = clippedCHIRPS
    .sum()
    .set({
      'Used_Images': imageAmount,
      'Start_Date': ee.Date(filteredCHIRPS.first().get('system:time_start')),
      'End_Date': ee.Date(filteredCHIRPS.limit(1, 'system:time_end', false).first().get('system:time_end')),
      'system:time_start': filteredCHIRPS.first().get('system:time_start'), //Add start date to new image
      'system:time_end': filteredCHIRPS.limit(1, 'system:time_end', false).first().get('system:time_end') //Add end date to new image
    });
  var time = ee.Date(summedCollection.get('system:time_end')).difference(ee.Date(summedCollection.get('system:time_start')), 'month').round();
  var summedImage = summedCollection.set({
    'Observed_Months': time
  });
return ee.Algorithms.If(
  time.gte(ee.Number.parse(timestep)),
  summedImage);
}));


  //Copy properties of CHIRPS collection to monthly collection
var summedChirpsCollection = ee.ImageCollection(PrecipitationSum.copyProperties(CHIRPS));


  //If the SPI should be calculated for more then 12 months, a different approach has to be used.
  //The following lines decide, which approach to use.
var SPI = ee.ImageCollection(ee.Algorithms.If(
  ee.Number.parse(timestep).gte(thresholdMonths),
  SpiGreaterEqual12(),
  SpiSmaller12()));

  //If the SPI should be calculated for less than 12 months, the DOY information have to be used
  //to find the correct images.
function SpiSmaller12 (){
    //Calculate Statistics
  var stats = summedChirpsCollection.map(function(toStats){
    var startDOY  = ee.Date(toStats.get('system:time_start')).getRelative('day', 'year');
    var endDOY = ee.Date(toStats.get('system:time_end')).getRelative('day', 'year');
    var collectionForStats = summedChirpsCollection
      .filter(ee.Filter.calendarRange(startDOY, endDOY, 'day_of_year'))
      .reduce(ee.Reducer.stdDev().combine(ee.Reducer.mean(), null, true));
    return toStats.addBands(collectionForStats);
  });


    //Calculate SPI
  var SPI1_11 = stats.map(function(toSPI){
    var bandForSPI = toSPI.select(['precipitation'], ['SPI']);
    var calc = toSPI.expression('(precipitation - mean) / stdDev',
    {
      precipitation: bandForSPI,
      mean: toSPI.select('precipitation_mean'),
      stdDev: toSPI.select('precipitation_stdDev')});
    return toSPI.addBands(calc);
  });
return SPI1_11;
}

  //If the SPI should be calculated for 12 or more months, the DOY information are not necessary.
  //However, from 12 months onwards, it is just possible to calculate the SPI for whole years.
  //Eg. for 24 or 48 months. Calculating an SPI-18 will not work within this script!
function SpiGreaterEqual12 (){
    //Calculate Statistics
  var stats = summedChirpsCollection.map(function(toStats){
    var collectionForStats = summedChirpsCollection
      .reduce(ee.Reducer.stdDev().combine(ee.Reducer.mean(), null, true));
    return toStats.addBands(collectionForStats);
  });

    //Calculate SPI
  var SPI12_n = stats.map(function(toSPI){
    var bandForSPI = toSPI.select(['precipitation'], ['SPI']);
    var calc = toSPI.expression('(precipitation - mean) / stdDev',
    {
      precipitation: bandForSPI,
      mean: toSPI.select('precipitation_mean'),
      stdDev: toSPI.select('precipitation_stdDev')});
    return toSPI.addBands(calc);
  });
return SPI12_n;
}

//******************************************************************************************************************************
//16-DAY SPI
//SPI from CHIRPS date in MODIS 16-days timeline


//Create a list with MODIS start Dates for each 16-day period
var listMillis = MODIS.aggregate_array('system:time_start');

//Turns the millis format of the list into a normal date format. A user provided shift in time will be reognised here as well
var listDates = listMillis.map(function(getDate){
  return ee.Date(getDate).advance(ee.Number.parse(shift), 'day');
});


//Sum up the CHIRPS precipitation data for each 16 day MODIS interval
var precipitation16Days = ee.ImageCollection.fromImages(listDates.map(function(summarize_16Days){
  var filterChirps = CHIRPS.filterDate(ee.Date(summarize_16Days), ee.Date(summarize_16Days).advance(ee.Number.parse(days), 'day'));
  var clippedCHIRPS = filterChirps.map(function(clip){return clip.clip(AOI)});
  var imageAmount = clippedCHIRPS.size();
  return ee.Algorithms.If(
    imageAmount.gte(ee.Number.parse(days)),
    clippedCHIRPS
      .sum()
      .setMulti({
        'Used_Images': imageAmount,
        'system:time_start': filterChirps.first().get('system:time_start'),
        'Start_Date': ee.Date(filterChirps.first().get('system:time_start')),
        'system:time_end': filterChirps.limit(1, 'system:time_end', false).first().get('system:time_end'),
        'End_Date': ee.Date(filterChirps.limit(1, 'system:time_end', false).first().get('system:time_end'))
      }));
}));


//Calculate statistics for each image
var stats16DayCollection = precipitation16Days.map(function(stats){
  var startDOY = ee.Date(stats.get('system:time_start')).getRelative('day', 'year');
  var endDOY = ee.Date(stats.get('system:time_end')).getRelative('day', 'year');
    //Calculate number of images used for mean and stdev calculations
  var imageAmount = precipitation16Days.filter(ee.Filter.calendarRange(startDOY, endDOY, 'day_of_year')).size();
  var collectionForStats = precipitation16Days
    .filter(ee.Filter.calendarRange(startDOY, endDOY, 'day_of_year'))
    .reduce(ee.Reducer.stdDev().combine(ee.Reducer.mean(), null, true));
  return stats.addBands(collectionForStats).setMulti({'Images_for_Stats': imageAmount});
});


//Calculate SPI
var Final16DayCollection = stats16DayCollection.map(function(toSPI16Days){
  var bandForSPI = toSPI16Days.select(['precipitation'], ['SPI_16Days']);
  var calc = toSPI16Days.expression('(precipitation - mean) / stdDev',
  {
    precipitation: bandForSPI,
    mean: toSPI16Days.select('precipitation_mean'),
    stdDev: toSPI16Days.select('precipitation_stdDev')});
  return toSPI16Days.addBands(calc);
});


//*************************************************************************************************************
//Add layers to map
print('The observed time period for the SPI-'+timestep+' begins on ', firstImage.format('YYYY-MM-dd'),'and ends on ', latestImage.format('YYYY-MM-dd'));

 Map.centerObject(AOI, 7); //Center map view to ROI

Map.addLayer(
  Final16DayCollection.limit(1, 'system:time_start', false).first(),
  SPI16DayVis,
  'SPI '+days+' days from '+ee.Date(Final16DayCollection.limit(1, 'system:time_start', false).first().get('system:time_start')).format('YYYY-MM-dd').getInfo());

Map.addLayer(SPI.limit(1, 'system:time_start', false),
  SPImonthlyVis,
  'SPI-'+timestep+' from '+ee.Date(SPI.limit(1, 'system:time_start', false).first().get('system:time_start')).format('YYYY-MM').getInfo())
//*************************************************************************************************************
//Create a chart of SPIs over time
//Add labels to ROI feature collection. Labels will be used for the charts
var RoiWithLabels = AOI.map(function(addLabels){
  var labelNames = addLabels
    .set('labelSpiMonth','SPI-'+timestep)
    .set('labelSpi16', 'SPI ('+days+' days)')
    .set('labelMonthlyPrecip', timestep+' Month(s) Precipitation Sum');
  return labelNames;
});

//Plot monthly precipitation chart
var ChartMonthlyPrecipitation = ui.Chart.image.seriesByRegion(
  summedChirpsCollection,
  RoiWithLabels,
  ee.Reducer.mean(),
  'precipitation',
  resolution, //Scale in meter
  'system:time_start',
  'labelMonthlyPrecip' //label
  ).setOptions({
    title: timestep+' Month(s) Precipitation Time Series (based on CHIRPS)',
    vAxis: {title: 'Precipitation in mm'},
    hAxis: {title: 'Year'},
    //legend: {position: 'none'},
    });

print(timestep+' month(s) precipitation chart based on mean values within AOI:',ChartMonthlyPrecipitation);

//Plot SPI Chart
var spiChart = ui.Chart.image.seriesByRegion(
  SPI,
  RoiWithLabels,
  ee.Reducer.mean(),
  'SPI',
  resolution, //Scale in meter
  'system:time_start',
  'labelSpiMonth' //label
  ).setOptions({
    title:  'SPI-'+timestep+' Time Series (based on CHIRPS)',
    vAxis: {title: 'SPI'},
    hAxis: {title: 'Year'},
    //legend: {position: 'none'},
    });

print('SPI-'+timestep+' chart based on mean values within AOI:',spiChart);

//Plot SPI-16-Day Chart
var spiChart16Days = ui.Chart.image.seriesByRegion(
  Final16DayCollection, //Image collection to be used
  RoiWithLabels, //Region that will be observed in Chart
  ee.Reducer.mean(), //Reducer type
  'SPI_16Days', //Band to be used
  resolution, //Scale in meter
  'system:time_start',
  'labelSpi16' //label
  ).setOptions({
    title: 'SPI '+days+'-Day Time Series (based on CHIRPS)',
    vAxis: {title: 'SPI'},
    hAxis: {title: 'Year'},
    //legend: {position: 'none'},
});
print(days+'-days SPI chart based on mean values within AOI:',spiChart16Days);

//*************************************************************************************************
//Inspector Chart
// Create a panel to hold the chart.
if (showInteractiveChart === true){
  var inspectorPanel = ui.Panel({
    style:{
      width: '400px',
      position: 'bottom-right'
    }
  });
  Map.add(inspectorPanel);

  // Register a function to draw a chart when a user clicks on the map.
  Map.onClick(function(coords) {
  inspectorPanel.clear();
  var point = ee.FeatureCollection(ee.Geometry.Point(coords.lon, coords.lat)).map(function(addLabels){
    var labelNames = addLabels.set('labelSPI', 'SPI-'+timestep);
  return labelNames;
  });

    //Button to hide Panel once the chart is loaded
  var hideButton = ui.Button({
    label: 'X',
    onClick: function(){
      inspectorPanel.clear();
    },
    style:{
      color: 'red',
    }
  });
  inspectorPanel.add(hideButton);

    //Chart to display data history of clicked point
  var inspectorChart = ui.Chart.image.seriesByRegion(
  SPI,
  point,
  ee.Reducer.mean(),
  'SPI',
  resolution, //Scale in meter
  'system:time_start',
  'labelSPI' //label
  ).setOptions({
    title: 'SPI-'+timestep+' Time Series (based on CHIRPS)',
    vAxis: {title: 'SPI'},
    hAxis: {title: 'Year'},
    //legend: {position: 'none'},
    });
  inspectorChart.setOptions({title: 'SPI-'+timestep+' for requested pixel'});
  inspectorPanel.add(inspectorChart);
  });
}

//*************************************************************************************************
//Create title
//Add Title
var title = ui.Label({
  value: 'Drought monitoring using the Standardized Precipitation Index (SPI)',
  style:{
  fontWeight: 'bold',
  fontSize: '18px'
  }});
title.style().set('position', 'top-center');
Map.add(title);

//*************************************************************************************************
//Create legend

//Get Max and Min values from imports-section with one decimal
var getMonthlyVisMax = Math.round(SPImonthlyVis.max*10)/10;
var getMonthlyVisMin = Math.round(SPImonthlyVis.min*10)/10;

var get16DayVisMax = Math.round(SPI16DayVis.max*10)/10;
var get16DayVisMin = Math.round(SPI16DayVis.min*10)/10;

var vizMonthly = {min: getMonthlyVisMin, max:getMonthlyVisMax, palette:SPImonthlyVis.palette};
var viz16Days = {min: get16DayVisMin, max:get16DayVisMax, palette:SPI16DayVis.palette};

//Add main panel which will contain smaller panels for each legend (SVI, EVI, Mean EVI)
    var mainPanel = ui.Panel({
      layout: ui.Panel.Layout.flow('horizontal'),
      style: {
        position: 'bottom-left',
        padding: '8px 15px'
      }
    });
//****************************************************
//Add new panel for monthly SPI legend within the main Panel
        var monthlySpiLegend = ui.Panel({
          style: {
             //position: 'bottom-left',
             padding: '0 0'
           }
        });
        mainPanel.add(monthlySpiLegend);

         //Create a checkbox which will enable a toggle function to show the SVI legend
        var monthlySpiCheckbox = ui.Checkbox('Show SPI-'+timestep+' Legend', false);
          //Provide information what happens if the checkbox is checked or unchecked
        monthlySpiCheckbox.onChange(function(checked) {
          if (checked) { //if it is checked, fill the SVI legend panel with information
              //Create first line of legend title
              var monthlySpiLegendTitle = ui.Label({
                value: 'SPI-'+timestep,
                style: {
                  fontWeight: 'bold',
                  fontSize: '18px',
                  margin: '0 auto',
                  padding: '0 auto'
                  }
              });

               // Add the title to the panel
              monthlySpiLegend.add(monthlySpiLegendTitle);

              // create the legend image
              var monthlySpiLon = ee.Image.pixelLonLat().select('latitude');
              var monthlySpiGradient = monthlySpiLon.multiply((vizMonthly.max-vizMonthly.min)/100.0).add(vizMonthly.min);
              var monthlySpiLegendImage = monthlySpiGradient.visualize(vizMonthly);

              // create text on top of legend
              var monthlySpiPanelMax = ui.Panel({
                  widgets: [
                    ui.Label(vizMonthly['max'])
                  ],
                  style: {
                    padding: '0 auto',
                    margin: '0 auto',
                    position: 'bottom-center'
                  }
                });

              monthlySpiLegend.add(monthlySpiPanelMax);

              // create thumbnail from the image
              var monthlySpiThumbnail = ui.Thumbnail({
                image: monthlySpiLegendImage,
                params: {bbox:'0,0,10,100', dimensions:'10x150'},
                style: {
                    padding: '0 auto',
                    margin: '0 auto',
                    position: 'bottom-center'
                  }
              });

              // add the thumbnail to the legend
              monthlySpiLegend.add(monthlySpiThumbnail);

              // create text on top of legend
              var monthlySpiPanelMin = ui.Panel({
                  widgets: [
                    ui.Label(vizMonthly['min'])
                  ],
                  style: {
                    padding: '0 auto',
                    margin: '0 auto',
                    position: 'bottom-center'
                  }
                  });

              monthlySpiLegend.add(monthlySpiPanelMin);


          } else {
            monthlySpiLegend.clear();
          }
        });
        print(monthlySpiCheckbox);

//****************************************************
//Add new panel for 16 Day SPI legend within the main Panel
        var Spi16Legend = ui.Panel({
          style: {
             //position: 'bottom-left',
             padding: '0 0'
           }
        });
        mainPanel.add(Spi16Legend);
         //Create a checkbox which will enable a toggle function to show the SVI legend
        var Spi16Checkbox = ui.Checkbox('Show '+days+'-Day SPI Legend', false);
          //Provide information what happens if the checkbox is checked or unchecked
        Spi16Checkbox.onChange(function(checked) {
          if (checked) { //if it is checked, fill the SVI legend panel with information
          //Create first line of legend title
            var Spi16LegendTitle = ui.Label({
              value: days+'-Day',
              style: {
                fontWeight: 'bold',
                fontSize: '18px',
                margin: '0 auto',
                padding: '0 auto'
                }
            });

             // Add the title to the panel
            Spi16Legend.add(Spi16LegendTitle);
              //Create second line of title
            var Spi16LegendTitle2 = ui.Label({
              value: 'SPI',
              style: {
                fontWeight: 'bold',
                fontSize: '18px',
                margin: '0 auto',
                padding: '0 auto'
                }
            });

             // Add the title to the panel
            Spi16Legend.add(Spi16LegendTitle2);

            // create the legend image
            var Spi16Lon = ee.Image.pixelLonLat().select('latitude');
            var Spi16Gradient = Spi16Lon.multiply((viz16Days.max-viz16Days.min)/100.0).add(viz16Days.min);
            var Spi16LegendImage = Spi16Gradient.visualize(viz16Days);

            // create text on top of legend
            var spi16PanelMax = ui.Panel({
                widgets: [
                  ui.Label(viz16Days['max'])
                ],
                style: {
                  padding: '0 auto',
                  margin: '0 auto',
                  position: 'bottom-center'
                }
              });

            Spi16Legend.add(spi16PanelMax);

            // create thumbnail from the image
            var spi16Thumbnail = ui.Thumbnail({
              image: Spi16LegendImage,
              params: {bbox:'0,0,10,100', dimensions:'10x150'},
              style: {
                  padding: '0 auto',
                  margin: '0 auto',
                  position: 'bottom-center'
                }
            });

            // add the thumbnail to the legend
              Spi16Legend.add(spi16Thumbnail);

            // create text on top of legend
            var spi16PanelMin = ui.Panel({
                widgets: [
                  ui.Label(viz16Days['min'])
                ],
                style: {
                  padding: '0 auto',
                  margin: '0 auto',
                  position: 'bottom-center'
                }
                });

            Spi16Legend.add(spi16PanelMin);


        } else {
          Spi16Legend.clear()
          }
        });
        print(Spi16Checkbox);


Map.add(mainPanel);

//*************************************************************************************************
print('List of dates for SPI-'+timestep,sortedTimeList);
print('CHIRPS collection with SPI-'+timestep+':',SPI);
print('List of dates for '+days+'-day SPI',listDates);
print(days+'-Day SPI collection', Final16DayCollection);
//Add exports to tasks tab
var batch = require('users/fitoprincipe/geetools:batch');

if (exportdata===true){
var ImageCollectionForExportMonthly = SPI.select(['SPI']).filterDate(startDateForDownload, endDateForDownload);
print('Selected images for SPI-'+timestep+' export',ImageCollectionForExportMonthly);
var ImageCollectionForExport16Day = Final16DayCollection.select(['SPI_16Days']).filterDate(startDateForDownload, endDateForDownload);
print('Selected images for 16-day SPI export',ImageCollectionForExport16Day);

batch.Download.ImageCollection.toDrive(ImageCollectionForExportMonthly, "SPI_ImageCollection",{
  name: 'SPI-'+timestep+'_from_{system_date}',
  scale: resolution,
  region: AOI
});

batch.Download.ImageCollection.toDrive(ImageCollectionForExport16Day, "SPI_ImageCollection",{
  name: 'SPI_'+days+'Days_{system_date}',
  scale: resolution,
  region: AOI
});
}

//=====================================================================================================
//                                          DISCLAIMER
//Map disclaimer
//The designations employed and the presentation of the material on this map do not imply the expression
//of any opinion whatsoever on the part of the Secretariat of the United Nations concerning the legal status
//of any country, territory, city or area or of its authorities, or concerning the delimitation of its
//frontiers or boundaries.
//Every effort is made to ensure this map is free of errors but there is no warrant the map or its
//features are either spatially or temporally accurate or fit for a particular use. This map is provided
//without any warranty of any kind whatsoever, either express or implied.


//When adjusting the visualisation parameters in the 'Layers' menu, the information within the legends
//will not change automatically. Import the new visualisation settings, delete the predefined  parameters
//from the 'Imports' section and rename your new parameters to the same name, that was used by
//the default parameter.

//Precipitation is usually not normal distributed. Therefore, a gamma probability function is typically applied.
//Due to limitations within the GEE, this script does not apply a gamma function and assumes a normal distribution
//of the precipitation data. Hence, the resulting SPI values can just be used as an estimator.


 6887
6887

 被折叠的 条评论
为什么被折叠?
被折叠的 条评论
为什么被折叠?
 到【灌水乐园】发言


