


 该博客围绕电商数据展开分析。先读取数据,按业务需求提取2020年数据并处理异常;接着进行数据清洗,处理重复值、异常值和缺失值,再规整数据;最后分析数据,涉及整体运营、销售趋势、流量渠道、用户行为等,并进行可视化展示,还介绍了客户RFM模型分析。
分析思路
- 读取数据
- 数据处理
- 数据分析及可视化
- 数据分析报告
一.读取数据
| EN | CN |
|---|---|
| id | 编号 |
| orderID | 订单编号 |
| userID | 用户编号 |
| goodsID | 商品编号 |
| orderAmount | 订单金额 |
| payment | 支付金额 |
| chanelID | 渠道编号 |
| platformType | 平台类型 |
| orderTime | 下单时间 |
| payTime | 支付时间 |
| chargeback | 退单拒付 |
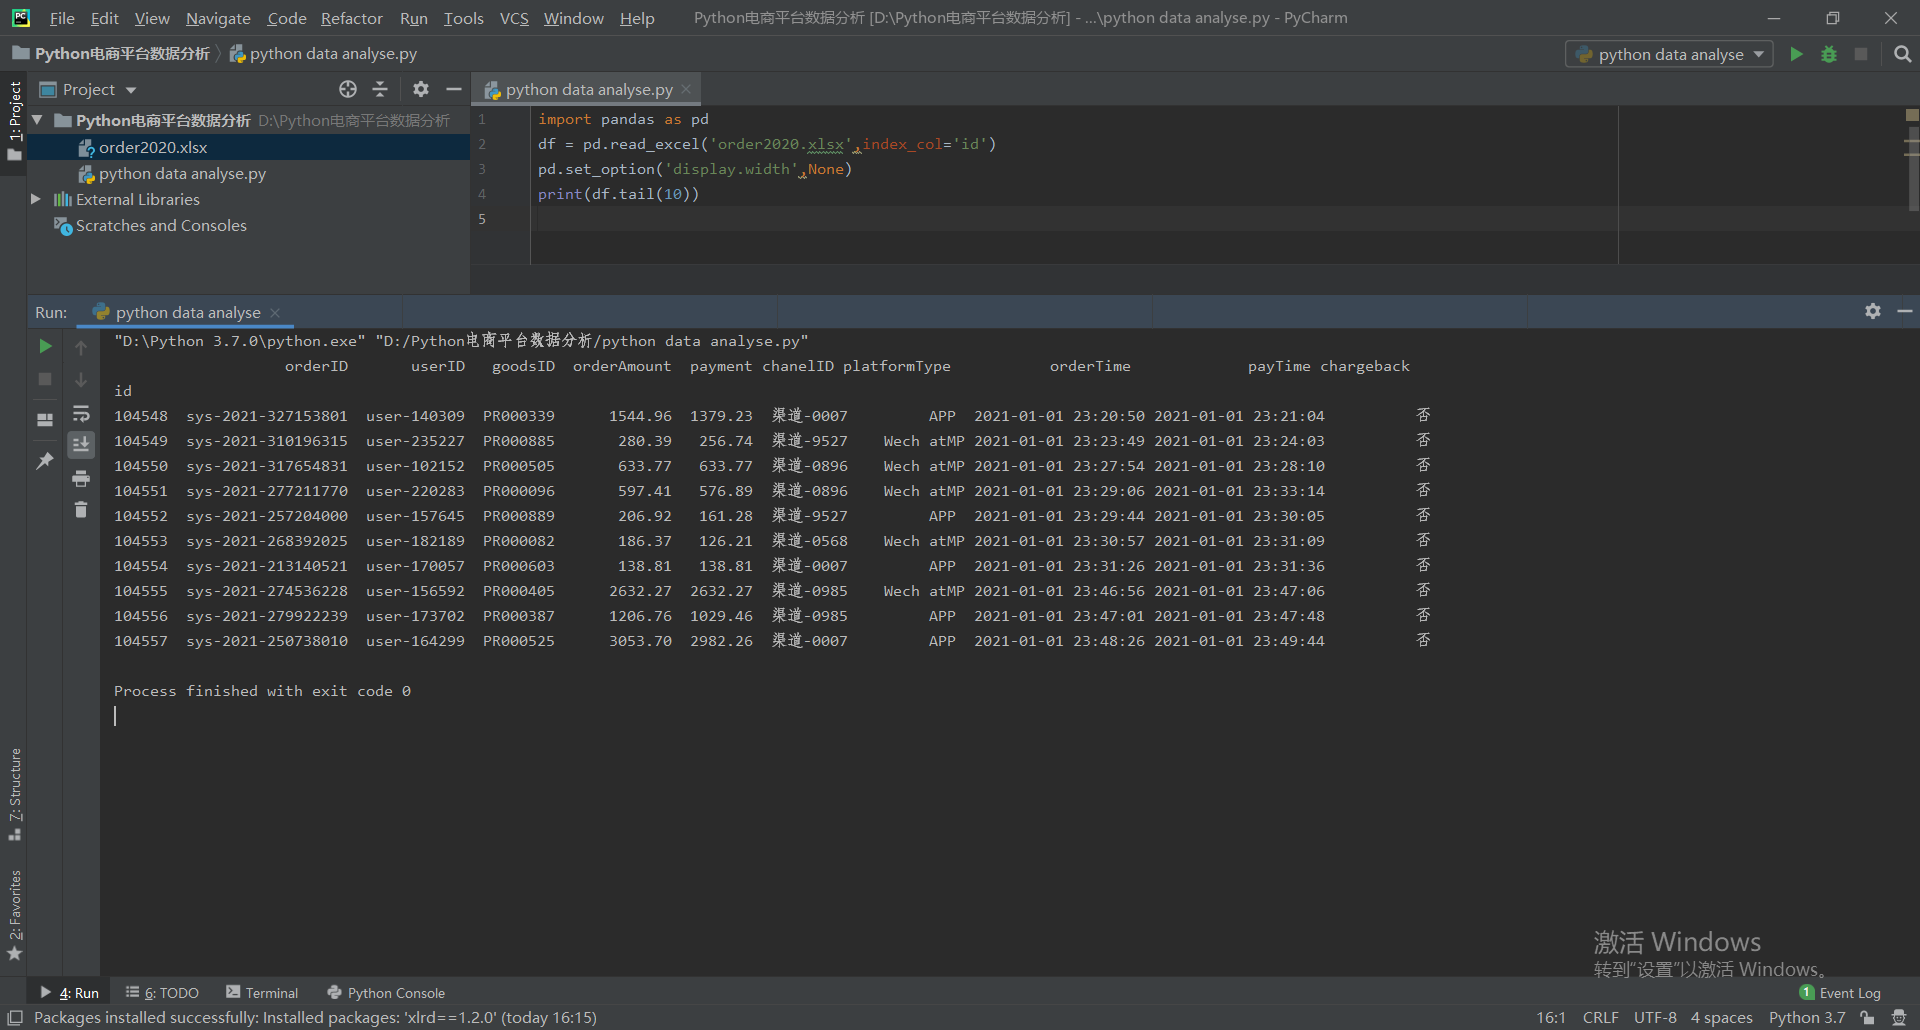
1.1 加载数据文件
import pandas as pd //加载处理数据所需要的库
df = pd.read_excel('order2020.xlsx',index_col='id')  //读取数据文件
#pd.set_option('display.width',None) //设置数据展示宽度
#print(df.tail(10)) //展示导入数据的后10行,以便检查
- pd.set_option('display.width',None) //设置数据展示宽度,解决列展示出现省略号问题
- print(df.head()) //默认读取前5行记录
- print(df.tail(10)) //读取后10行的数据,无参默认为5行

1.2 提取数据
1.2.1根据业务需要提取数据,提取2020年数据
# 1.引入时间模块, 确定周期时间
import datetime

# 2.确定开始时间节点与结束时间节点
startTime = datetime.datetime(2020, 1, 1) #开始时间
endTime = datetime.datetime(2020, 12, 31, 23, 59, 59) #结束时间

# 3.将2020年1月1日前数据删除
df[df.orderTime < startTime]
#删除数据 drop(index="索引", inplace=True,False)
df.drop(index=df[df.orderTime < startTime].index, inplace=True)

# 4.将2020年12月31日后数据删除
df[df.orderTime > endTime]
df.drop(index=df[df.orderTime > endTime].index, inplace=True)

1.2.2提取数据时,处理与业务流程不符合数据、支付时间间隔过长数据
# 1.下单时间与支付时间间隔
df['payinterval'] = (df.payTime-df.orderTime).dt.total_seconds()

# 2.支付时间间隔大于30分钟与支付时间早于下单时间
df[df.payinterval>1800]
df.drop(index=df[df.payinterval>1800].index, inplace=True)
df.drop(index=df[df.payinterval<0].index, inplace=True)

1.2.3提取数据时,处理与业务流程不符合数据,订单金额与支付金额为负
# 1.订单金额为负
df[df.orderAmount < 0]
# 2.付款金额为负
df[df.payment < 0]
# 3.删除相应订单
df.drop(index=df[df.orderAmount < 0].index, inplace=True) #删除负订单金额
df.drop(index=df[df.payment < 0].index, inplace=True) #删除负付款金额

二.数据处理
查看数据
#1.查看非空信息
df.info()
#2. 查看整体描述
df.describe()

2.1 数据清洗
脏数据类型
- 重复值
- 异常值
- 缺失值
脏数据处理方式

2.1.1 清洗orderID
#1.订单orderID不重复的个数
df.orderID.unique().size
#2.删除重复数据
df.drop(index=df[df.orderID.duplicated()].index, inplace=True)
df.info()

2.1.2 清洗goodsID
#PR000000  商品下架
df.goodsID[df.goodsID == 'PR000000'].size
df.drop(index=df[df.goodsID == 'PR000000'].index, inplace=True)
df.info()

2.1.3 清洗chanelID
#1.查看chanelID空值
df[df.chanelID.isnull()]
#2.对空值进行修补
df['chanelID'].fillna(value=df.chanelID.mode()[0], inplace=True)
df.info()

2.1.4 清洗platformtype
print(df.platformType.unique()) #列出所有不重复平台
df['platformType']=df['platformType'].str.replace(" ","") #空字符串代替空格
print(df.platformType.unique()) #列出所有不重复平台,再次检查

2.1.5 清洗payment
# 1.创建折扣字段
df['discount'] = (df.payment/df.orderAmount)
df.describe()
# 2.平均折扣
meanDiscount = df[df['discount']<=1].discount.sum() / df[df['discount']<=1].discount.size
meanDiscount
# 3.找到折扣大于1的数据
df[df['discount']>1]
df['payment'] = df['payment'].mask(df['discount']>1,None)
# 4.对折扣大于1的数据进行填补
df['payment'].fillna(value=df.orderAmount*meanDiscount , inplace=True)
df.info()
# 5.处理折扣
df['discount'] = round((df.payment/df.orderAmount),2)
pd.set_option('display.width',None)
print(df)

2.2 数据规整
df['month'] = df['orderTime'].dt.month #提取月份
df['weekday'] = df['orderTime'].dt.dayofweek+1 #周几
df['orderDate'] = df['orderTime'].dt.date
#print(df)

数据处理完毕 查看数据
print(df.describe())
输出结果:
         orderAmount        payment    payinterval       discount          month        weekday
count  103146.000000  103146.000000  103146.000000  103146.000000  103146.000000  103146.000000
mean     1050.466247     993.373100      59.438204       0.917957       7.157835       3.885211
std      1054.020910    1042.470804     127.309944       0.138318       3.299359       1.937466
min         6.100000       0.000000       0.000000       0.000000       1.000000       1.000000
25%       432.495000     379.310000      15.000000       0.900000       5.000000       2.000000
50%       680.620000     627.890000      23.000000       0.960000       7.000000       4.000000
75%      1249.685000    1193.792500      46.000000       1.000000      10.000000       5.000000
max     28465.250000   28465.250000    1788.000000       1.000000      12.000000       7.000000

Process finished with exit code 0
三.分析数据及可视化
3.1 分析数据,整体运营情况
#总体概览
# 1.销售GMV
df.orderAmount.sum()/10000  #10835
# 2.成交总和
df.payment.sum()/10000     #10246
# 3.实际成交额
df[df.chargeback=="否"].payment.sum()/10000  # 8879
# 4.订单数量
df.orderID.unique().size  #103146
# 5.退货订单数
df[df.chargeback=="是"].orderID.size  #13590
# 6.退货率
df[df.chargeback=="是"].orderID.size/df.orderID.unique().size
# 7.用户数
df.userID.unique().size #78525
3.2销售情况,各月份GMV\成交额趋势
#1.绘制图形
#1.1引入相应的库
from PythonDataAnalyse import df #调用PythonDataAnalyse.py的df函数

import matplotlib.pyplot as plt
from matplotlib.font_manager import FontProperties

plt.rcParams['font.sans-serif'] = ['SimHei']
plt.rcParams['font.serif'] = ['SimHei']
plt.rcParams['axes.unicode_minus'] = False

#1.2设置字体
my_font =FontProperties(fname='C:/Windows/Fonts/Deng.ttf',size=12,)

#1.3设置画布大小
plt.figure(figsize=(10,6))

#1.4设置网格线 辅助线
plt.grid(alpha=0.4)

#2.横纵坐标值
#2.1所有横坐标都一致
x = df.groupby('month')['orderAmount'].sum().index
#2.2GMV
y1 = df.groupby('month')['orderAmount'].sum().values/10000
#2.3销售实际付款
y2 = df.groupby('month')['payment'].sum().values/10000
#2.4不含退单销售额
y3 = df[df.chargeback=="否"].groupby('month')['payment'].sum().values/10000

#2.5 X横轴坐标文字
x_ticks_label = ["{}月份".format(i) for i in x]
#2.6 x轴刻度,标签文字
plt.xticks(x,x_ticks_label,rotation = 45,fontproperties = my_font)

#3. 绘制三条折线走势
#plot 折线图
#color 单词,#0022FF rgb(0,255)
plt.plot(x,y1,label='GMV',color="red",marker='o')
plt.plot(x,y2,label='销售额',color="orange",marker='*')
plt.plot(x,y3,label='不含退单',color="blue",marker = '.')

#4.标记横纵轴名字与标题
plt.xlabel('月份',fontproperties=my_font)
plt.ylabel("销售额万元",fontproperties=my_font)
plt.title('销售额走势',fontproperties=my_font,color='red',size=15)

#5.添加折点坐标
for a,b in zip(x,y1):
    plt.annotate('(%.2f)'%(b),xy=(a,b),xytext=(-10,10),textcoords='offset points')

#6.设置图例
plt.legend(prop=my_font,loc='upper left')
#7.显示图形
#plt.show()
plt.savefig('t1.png')
** plt.rcParams['font.sans-serif'] = ['SimHei']
plt.rcParams['font.serif'] = ['SimHei']
plt.rcParams['axes.unicode_minus'] = False ** 此三行根治matplotlib中文乱码

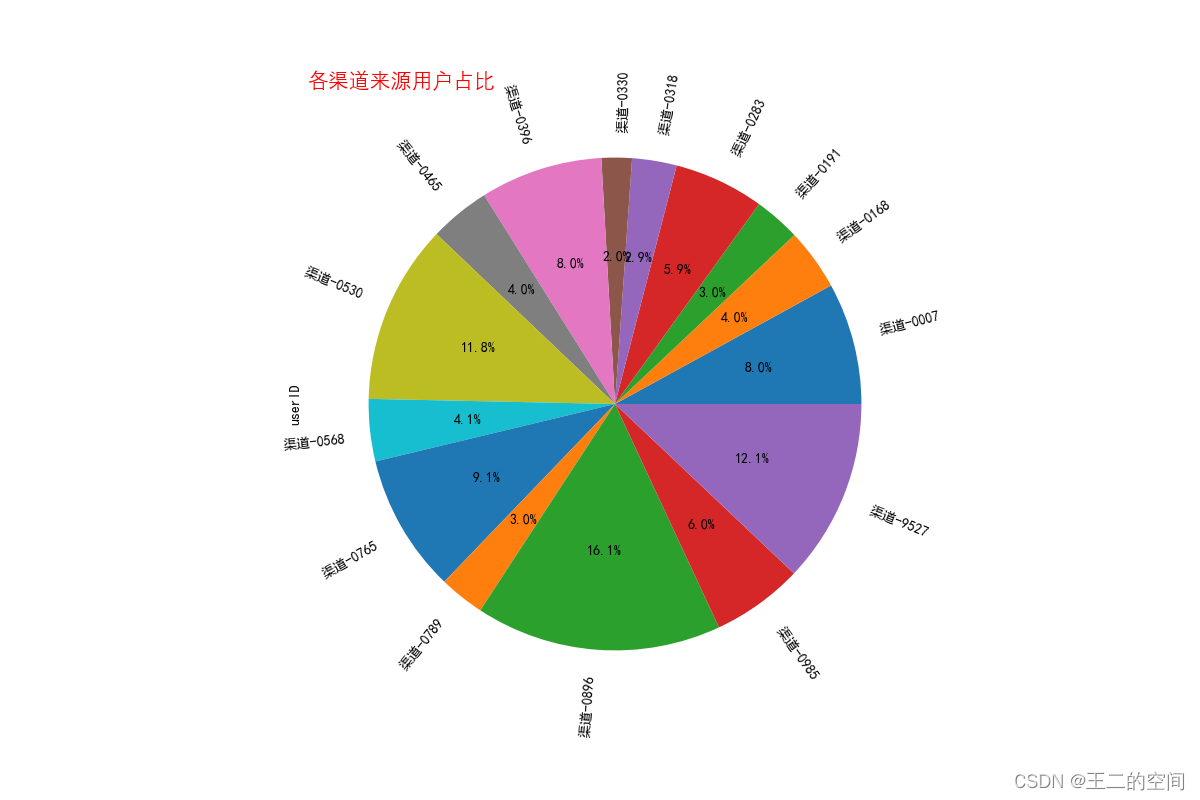
3.3 流量渠道来源分析
from PythonDataAnalyse import df
import matplotlib.pyplot as plt

from matplotlib.font_manager import FontProperties

my_font =FontProperties(fname='C:/Windows/Fonts/Deng.ttf',size=12,)

#1.按照渠道分组聚合,统计用户数
custom = df.groupby('chanelID')['userID'].count()
#2.设置字体
plt.rcParams['font.sans-serif']=['SimHei']
#3.使用pandas中方法直接画图
custom.plot.pie(figsize=(12,8),labels=custom.index,autopct="%1.1f%%",rotatelabels=True)
#4.设置标题
plt.title('各渠道来源用户占比',loc='left',fontproperties=my_font,color='red',size=15)
plt.savefig('t2.png')
3.4 用户行为, 研究周一到周日哪天订单量最高
from PythonDataAnalyse import df
import matplotlib.pyplot as plt
from matplotlib.font_manager import FontProperties

my_font =FontProperties(fname='C:/Windows/Fonts/Deng.ttf',size=12,)
plt.rcParams['font.sans-serif'] = ['SimHei']
plt.rcParams['font.serif'] = ['SimHei']
plt.rcParams['axes.unicode_minus'] = False
#1.按周几做聚合
week = df.groupby('weekday')['orderID'].count()
week

#2.设置横纵坐标
weekX = ['周一','周二','周三','周四','周五','周六','周日']
weekY = week.values

#3.设置X轴
plt.xticks(range(len(weekX)),weekX,fontproperties=my_font)

#4.设置条形图
rects = plt.bar(range(len(weekX)),weekY,width=0.3,color=['r','g','b'])

#5.设置每个数据条的位置
for rect in rects:
    height = rect.get_height()
    plt.text(rect.get_x() + rect.get_width() / 2, height+0.5, str(height),ha="center")

#6.设置标题
plt.title('用户下单时间分析',fontproperties=my_font,color='red',size=15)
#7.显示保存
plt.savefig('t3.png')

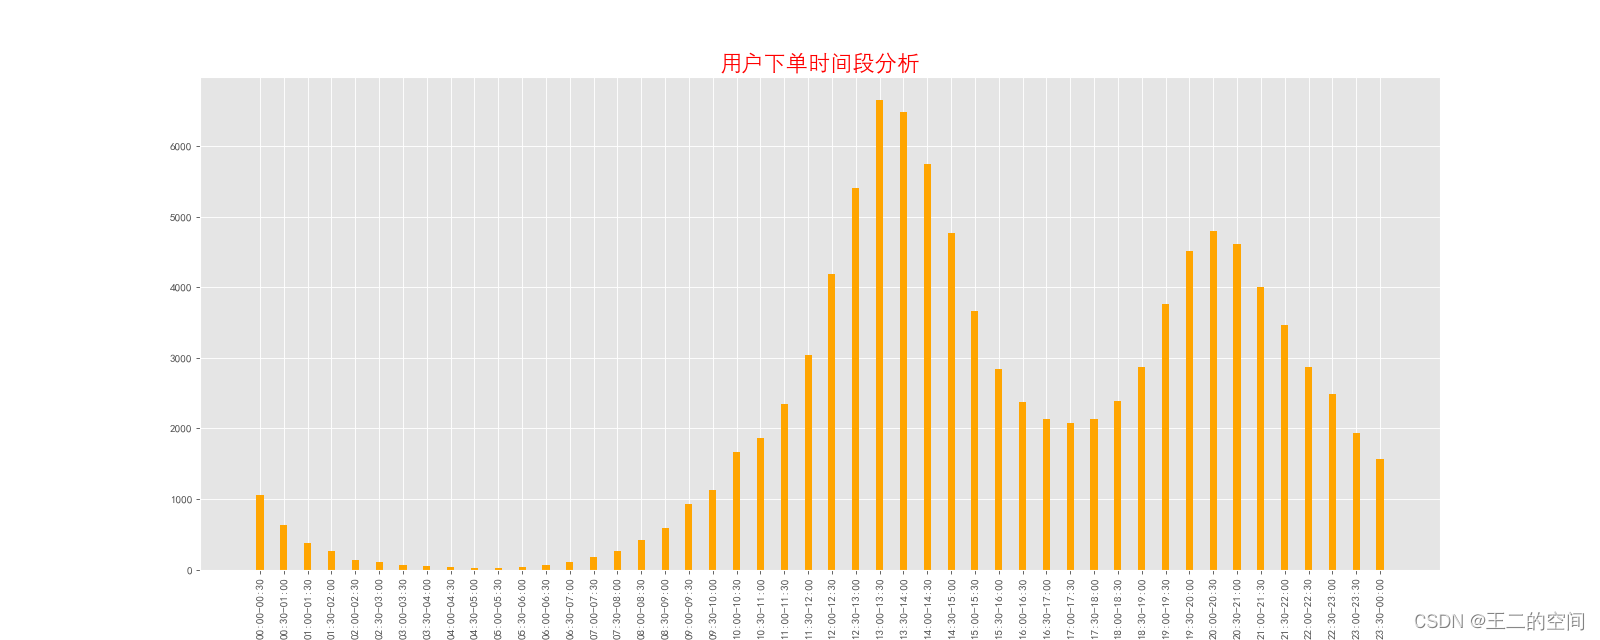
3.5 用户行为, 哪个时间段下单量最高
from PythonDataAnalyse import pd
from PythonDataAnalyse import df
import matplotlib.pyplot as plt
from matplotlib.font_manager import FontProperties

my_font =FontProperties(fname='C:/Windows/Fonts/Deng.ttf',size=12,)
plt.rcParams['font.sans-serif'] = ['SimHei']
plt.rcParams['font.serif'] = ['SimHei']
plt.rcParams['axes.unicode_minus'] = False

#1.备份整个数据
df1 = df.copy()

#2.设置时间周期30min
s = df1['orderTime'].dt.floor('30T')

#3.将下单时间转换成时间段
df1['orderTime'] = s.dt.strftime('%H:%M') + '-' + (s + pd.Timedelta(30 * 60, unit='s')).dt.strftime('%H:%M')
df1
#4.根据时间段分组聚合
tiemdf = df1.groupby('orderTime')['orderID'].count()
tiemdf
tiemdfX = tiemdf.index
tiemdfY = tiemdf.values
tiemdfY

#5.设置画布大小
plt.figure(figsize=(20,8),dpi=80)

#6.设置样式风格
plt.style.use('ggplot')

#7.X轴形式
plt.xticks(range(len(tiemdfX)),tiemdfX,rotation=90)

#8.绘制数据条形图
rect = plt.bar(tiemdfX,tiemdfY,width=0.3,color=['orange'])
plt.title('用户下单时间段分析',fontproperties=my_font,color='red',size=20)
plt.savefig('t4.png')
3.6用户行为,客户情况
#1.客单价
df.orderAmount.sum()/df.userID.unique().size
#1379.8330665393187

#1.检查数据字段
df['userid'] = df["userID"].str[0:4]
df['userid'].unique()

#2.userID只保留数字
df['userID'] = df["userID"].str[5:]
输出结果:
"D:\Python 3.7.0\python.exe" D:/Python电商平台数据分析/UserBehavior2.py
                   orderID  userID   goodsID  orderAmount  payment chanelID platformType           orderTime             payTime chargeback  payinterval  discount  month  weekday   orderDate userid
id
6       sys-2020-279103297  146548  PR000564       425.20   425.20  渠道-0765     WechatMP 2020-01-01 00:12:23 2020-01-01 00:13:37          否         74.0      1.00      1        3  2020-01-01   user
7       sys-2020-316686066  104210  PR000709      1764.37  1707.04  渠道-0396     WechatMP 2020-01-01 00:23:06 2020-01-01 00:23:32          否         26.0      0.97      1        3  2020-01-01   user
8       sys-2020-306447069  104863  PR000499       499.41   480.42  渠道-0007     WechatMP 2020-01-01 01:05:50 2020-01-01 01:06:17          否         27.0      0.96      1        3  2020-01-01   user
9       sys-2020-290267674  206155  PR000253      1103.00  1050.95  渠道-0330          APP 2020-01-01 01:16:12 2020-01-01 01:16:25          否         13.0      0.95      1        3  2020-01-01   user
10      sys-2020-337079027  137939  PR000768       465.41   465.41  渠道-9527        ALiMP 2020-01-01 01:31:00 2020-01-01 01:31:36          否         36.0      1.00      1        3  2020-01-01   user
...                    ...     ...       ...          ...      ...      ...          ...                 ...                 ...        ...          ...       ...    ...      ...         ...    ...
104297  sys-2020-344079195  182248  PR000813       831.29   766.07  渠道-0896     WechatMP 2020-12-31 23:32:55 2020-12-31 23:33:06          否         11.0      0.92     12        4  2020-12-31   user
104298  sys-2020-296195955  143322  PR000938      1565.67  1414.89  渠道-0007          APP 2020-12-31 23:33:05 2020-12-31 23:34:36          是         91.0      0.90     12        4  2020-12-31   user
104299  sys-2020-382387725  220484  PR000782      3326.83  3273.54  渠道-0530          WEB 2020-12-31 23:37:30 2020-12-31 23:37:44          否         14.0      0.98     12        4  2020-12-31   user
104300  sys-2020-303891464  285133  PR000096       241.75   241.75  渠道-0765     WechatMP 2020-12-31 23:38:43 2020-12-31 23:39:01          是         18.0      1.00     12        4  2020-12-31   user
104301  sys-2020-291405901  298747  PR000369       442.85   339.78  渠道-0283     WechatMP 2020-12-31 23:48:34 2020-12-31 23:49:04          否         30.0      0.77     12        4  2020-12-31   user

[103146 rows x 16 columns]

Process finished with exit code 0
3.7用户行为,客户复购率
# 分析复购率
# 将用户消费数据进行数据透视。
# 统计每个用户在每月的订单量,所以userID是index,month是column。
pivoted_counts=df.pivot_table(index='userID',columns='month',
                             values='orderTime',aggfunc='count').fillna(0)
pivoted_counts.head()
print(pivoted_counts)
输出结果:
"D:\Python 3.7.0\python.exe" D:/Python电商平台数据分析/UserBehavior2.py
month    1    2    3    4    5    6    7    8    9    10   11   12
userID
100000  0.0  0.0  0.0  0.0  0.0  0.0  0.0  0.0  0.0  1.0  0.0  0.0
100003  0.0  0.0  0.0  0.0  1.0  0.0  0.0  0.0  0.0  0.0  0.0  0.0
100006  0.0  0.0  0.0  0.0  0.0  0.0  0.0  0.0  0.0  1.0  1.0  0.0
100007  1.0  0.0  0.0  0.0  0.0  0.0  0.0  0.0  0.0  0.0  0.0  0.0
100008  0.0  0.0  0.0  0.0  0.0  0.0  0.0  0.0  0.0  0.0  1.0  0.0
...     ...  ...  ...  ...  ...  ...  ...  ...  ...  ...  ...  ...
299980  0.0  0.0  0.0  0.0  0.0  0.0  0.0  0.0  0.0  1.0  0.0  0.0
299983  0.0  0.0  0.0  0.0  0.0  0.0  0.0  0.0  0.0  0.0  0.0  1.0
299989  0.0  0.0  0.0  1.0  0.0  0.0  0.0  0.0  0.0  0.0  1.0  0.0
299992  1.0  0.0  0.0  0.0  0.0  0.0  0.0  0.0  0.0  0.0  0.0  0.0
299995  0.0  0.0  1.0  0.0  0.0  0.0  0.0  0.0  0.0  0.0  0.0  0.0

[78525 rows x 12 columns]

Process finished with exit code 0
###复购率分析图输出
from PythonDataAnalyse import df
from matplotlib.font_manager import FontProperties
import matplotlib.pyplot as plt

my_font =FontProperties(fname='C:/Windows/Fonts/Deng.ttf',size=12,)
plt.rcParams['font.sans-serif'] = ['SimHei']
plt.rcParams['font.serif'] = ['SimHei']
plt.rcParams['axes.unicode_minus'] = False

pivoted_counts=df.pivot_table(index='userID',columns='month',
  values='orderTime',aggfunc='count').fillna(0)
pivoted_counts.head()
#复购率
# 复购率的定义是在某时间窗口内消费两次及以上的用户在总消费用户中占比。这里的时间窗口是月。

#1.引入numpy
import numpy as np

#2. 将数据转换一下,消费两次及以上记为1,消费一次记为0,没有消费记为NaN。
pcRepeatBuy =pivoted_counts.applymap(lambda x: 1 if x>1 else np.NaN if x==0 else 0)
pcRepeatBuy.head()

#3.绘图
#用sum和count相除即可计算出复购率。count是总的消费用户数,sum是两次以上的消费用户数。
(pcRepeatBuy.sum()/pcRepeatBuy.count()).plot(figsize=(15,6))

plt.title('复购率分析',fontproperties=my_font,color='red',size=15)
plt.savefig('t5.png')

3.8用户行为,客户RFM模型
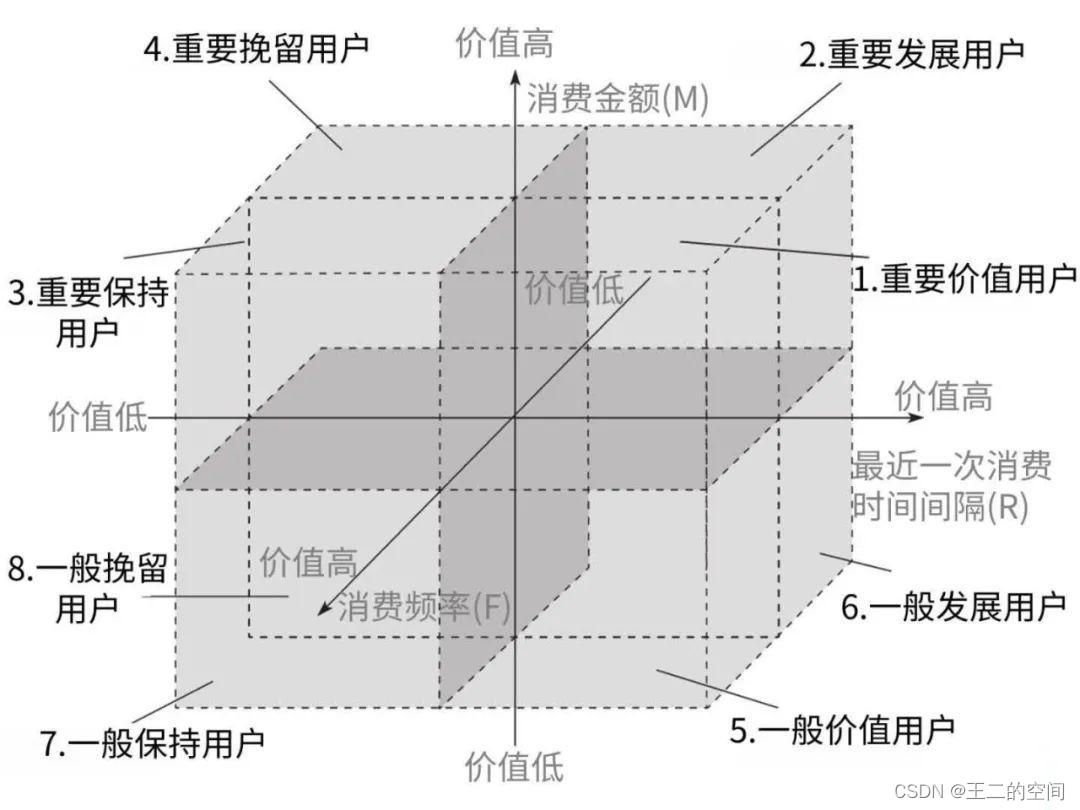
###RFM均值算法总结:整体思路如下
- 获取到相应数据
- 改变整个数据,将CustomerID作为索引
- 添加orders字段,每一单的orders为1
- 计算每位用户的OrderDate, orders, Sales(OrderDate 应该取用户最后一次购买日期, orders求和, Sales求和)
- 将用户OrderDate, orders, Sales转换成R值,F值,M值
- 将每位用户的R值,F值,M值与整体的平均值进行比较,赋0或者1, 并给用户标记用户类型
- 对用户RFM模型进行分析
from PythonDataAnalyse import df
#RFM根据用户的活跃程度,频率,贡献程度 分类

#1.备份整个数据
customdf = df.copy()

#2.删除退单
customdf.drop(index=df[df.chargeback == '是'].index, inplace=True)
customdf

#3.将userID设置为索引
customdf.set_index('userID',drop=True,inplace=True)

#4.将原始订单中订单量全部置为1
customdf['orders'] = 1
customdf

#5.数据透视
rfmdf = customdf.pivot_table(index=['userID'],
  values=['orderAmount','orderDate','orders'],
  aggfunc={'orderDate':'max',
  'orderAmount':'sum',
  'orders':'sum'})

#6.处理RFM模型中的R
rfmdf['R'] = (rfmdf.orderDate.max()-rfmdf.orderDate).dt.days

#7.处理RFM模型中的F与M
rfmdf.rename(columns={'orderAmount':'M','orders':'F'},inplace=True)
rfmdf.head()
print(rfmdf.describe())
输出结果:
"D:\Python 3.7.0\python.exe" D:/Python电商平台数据分析/RFM.py
                  M             F             R
count  70493.000000  70493.000000  70493.000000
mean    1332.341220      1.270424    149.025761
std     1318.826745      0.548193     99.848267
min        6.100000      1.000000      0.000000
25%      494.850000      1.000000     60.000000
50%      843.840000      1.000000    138.000000
75%     1762.990000      1.000000    222.000000
max    32623.050000      7.000000    365.000000

Process finished with exit code 0
#1. 对用户分类,设置标签
def rfm_func(x):
    level = x.apply(lambda x: "1" if x >= 0 else '0')
    label = level.R + level.F + level.M
    d = {
        '011':'重要价值客户',
        '111':'重要唤回客户',
        '001':'重要深耕客户',
        '101':'重要挽留客户',
        '010':'潜力客户',
        '110':'一般维持客户',
        '000':'新客户',
        '100':'流失客户'
    }
    result = d[label]
    return result

#2.根据模型打标签
rfmdf['label'] = rfmdf[['R','F','M']].apply(lambda x:x-x.mean()).apply(rfm_func,axis=1)

#3.分组聚合
rfmdf_res = rfmdf.groupby('label').count()
print(rfmdf_res)
输出结果:
"D:\Python 3.7.0\python.exe" D:/Python电商平台数据分析/RFM.py
            M  orderDate      F      R
label
一般维持客户   1352       1352   1352   1352
新客户     19910      19910  19910  19910
流失客户    22168      22168  22168  22168
潜力客户     3844       3844   3844   3844
重要价值客户   8080       8080   8080   8080
重要唤回客户   2641       2641   2641   2641
重要挽留客户   6847       6847   6847   6847
重要深耕客户   5651       5651   5651   5651

Process finished with exit code 0
##各类型客户图
import matplotlib.pyplot as plt
from matplotlib.font_manager import FontProperties

plt.rcParams['font.sans-serif'] = ['SimHei']
plt.rcParams['font.serif'] = ['SimHei']
plt.rcParams['axes.unicode_minus'] = False

my_font =FontProperties(fname='C:/Windows/Fonts/Deng.ttf',size=12,)#1.绘制图形
rfmdf.label.value_counts().plot.bar(figsize=(20,9))
#2.设置X轴
plt.xticks(rotation=0,fontproperties=my_font)
plt.savefig('t6.png')


 6509
6509


 到【灌水乐园】发言


