


0、声明
未经声明的matlab版本是在2016版本上进行测试使用的,有小伙伴反映2022版本的matlab无法使用的情况,将内容更新在drawmap更新2中
1、数据准备
地理信息地图在进行绘制的过程中,叠加上行政区域,更方便进行位置定位,更有利于针对问题进行具体分析。
本文提供了两个Matlab函数,方便在画图时进行行政区域地图叠加操作。
中国区域各种行政划分河流数据等shp文件,请自行下载,百度云链接链接:https://pan.baidu.com/s/1N6MIFYPHTz8Xpf3gCjvutw 提取码:082d
2、相关Matlab代码及使用方法
叠加中国区域行政地图的函数如下:
将下边函数复制,加载到matlab环境中,在需要进行叠加行政地图的区域使用drawmap(‘省’)即可完成行政区域的叠加操作,结果如下图所示。
function drawmap(Province, varargin)

% drawmap: Add administrative region information for a specified province on the canvas
% use whith default configuration    -->  drawmap('湖北省')
% use whithout global map            -->  drawmap('湖北省', 'global', 0)

% ------------------------------------------------------------ %
% Author:          Muyeqingfeng
% e-mail address:  muyeqingfeng@126.com
% Release date:    2023/05/05

ip = inputParser;
ip.addParamValue('global', 1);
parse(ip,varargin{:});

% decoding the shp file wiht GBK
feature('DefaultCharacterSet', 'GBK');
path = 'shp_path';
China1=shaperead([path,'省.shp']);
China2=shaperead([path,'市.shp']);

idx1 = 0;
idx2 = [];
% Provincial  boundary infomation
for i=1:length(China1)
    if strcmp(China1(i).x0xCA0xA1,Province), idx1=i;end
end
% Market boundary information
for j=1:length(China2)
    if strcmp(China2(j).x0xCA0xA1,Province), idx2=[idx2,j];end
end

if ip.Results.global == 1
    % the whole china info
    plot([China1(:).X],[China1(:).Y],'color',[0.2 0.2 0.2],'linewidth',1.0); hold on
end
% the special Province
plot([China1(idx1).X],[China1(idx1).Y],'color','r','linewidth',1.5); hold on
% all of the city of the special Province
plot([China2(idx2).X],[China2(idx2).Y],'color','k','linewidth',0.8); hold on
set(gca,'Layer','top');
end
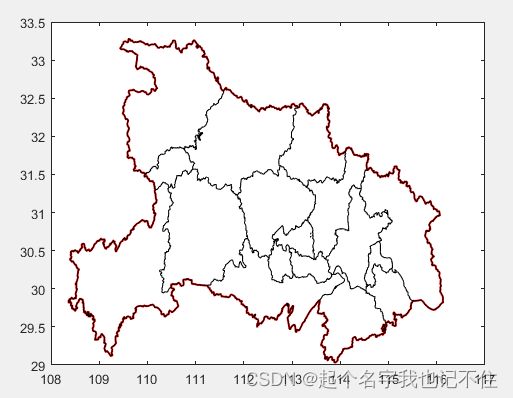
函数调用结果展示
figure;drawmap('湖北省')

figure;drawmap('湖北省','global', 0)
3、图片固定位置信息标注
以下提供了一个函数,在绘制图像时,在图像固定比例处进行信息标注,使得图像信息显得整齐一致
function text_info(varargin)
% text_info: Print information in a fixed position on the image
% use with the default configuration                               --->  text_info('text', 'the info need to print')
% change the position the display the info                         --->  text_into('xi', 0.1, 'yi', 0.2)
% change the color/fontsize of the display the info                --->  text_into('color', 'r', 'ftsiz', 20)

% ------------------------------------------------------------ %
% Author:          Muyeqingfeng
% e-mail address:  muyeqingfeng@126.com
% Release date:    2023/05/05

ip = inputParser;
ip.addParamValue('xi', 0.1);
ip.addParamValue('yi', 0.1);
ip.addParamValue('text', 'test');
ip.addParamValue('ftsiz', 30);
ip.addParamValue('color', 'k');
parse(ip,varargin{:});

hh=get(gca);
X=hh.XLim;
Y=hh.YLim;
k3=[ip.Results.xi ip.Results.yi];
x_3=X(1)+k3(1)*(X(2)-X(1));
y_3=Y(1)+k3(2)*(Y(2)-Y(1));
text(double(x_3),double(y_3),ip.Results.text,'color',ip.Results.color,'fontweight','bold','fontsize',ip.Results.ftsiz-12);

end
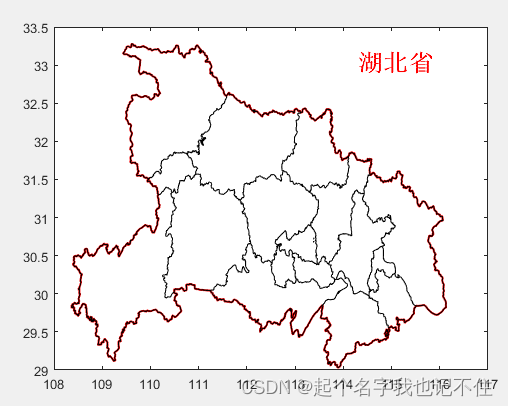
函数调用结果展示
figure;drawmap('湖北省')
text_info('text', '湖北省')

figure;drawmap('湖北省', 'global', 0)
text_info('text', '湖北省', 'xi', 0.7,'yi', 0.9,'color', 'r')

drawmap更新
drawmap更新,只画整个中国的图,不重点标出某一省份
function drawmap(varargin)

% drawmap: Add administrative region information for a specified province on the canvas
% use whith default configuration  -->  drawmap('湖北省')
% use whithout global map            -->  drawmap('湖北省', 'global', 0)

% ------------------------------------------------------------ %
% Author:             Muyeqingfeng
% e-mail address: muyeqingfeng@126.com
% Release date:    2023/05/05

ip = inputParser;
ip.addParamValue('global', 1)
ip.addParamValue('Province', 0);
parse(ip,varargin{:});

feature('DefaultCharacterSet', 'GBK');
path = 'D:\My_Document\Code\Practice\data\全国shp\最新2021年全国行政区划\';
China1=shaperead([path,'省.shp']);
China2=shaperead([path,'市.shp']);

idx1 = 0;
idx2 = [];

if ip.Results.Province ~= 0
    % Provincial  boundary infomation
    for i=1:length(China1)
        if strcmp(China1(i).x0xCA0xA1,ip.Results.Province), idx1=i;end
    end

    % Market boundary information
    for j=1:length(China2)
        if strcmp(China2(j).x0xCA0xA1,ip.Results.Province), idx2=[idx2,j];end
    end
end


if ip.Results.global == 1
    % the whole china info
    plot([China1(:).X],[China1(:).Y],'color',[0.2 0.2 0.2],'linewidth',1.0); hold on
end


if ip.Results.Province ~= 0
    % the special Province
    plot([China1(idx1).X],[China1(idx1).Y],'color','r','linewidth',1.5); hold on
    % all of the city of the special Province
    plot([China2(idx2).X],[China2(idx2).Y],'color','k','linewidth',0.8); hold on
end
set(gca,'Layer','top');
end

drawmap更新1
function drawmap(varargin)

% drawmap: Add administrative region information for a specified province on the canvas
% use whith default configuration  -->  drawmap('湖北省')
% use whithout global map            -->  drawmap('湖北省', 'global', 0)

% ------------------------------------------------------------ %
% Author:             Muyeqingfeng
% e-mail address: muyeqingfeng@126.com
% Release date:    2023/05/05

ip = inputParser;
ip.addParamValue('global', 1)
ip.addParamValue('Province', 0);
ip.addParamValue('City', 0);
ip.addParamValue('County', 0);
parse(ip,varargin{:});

% feature('DefaultCharacterSet', 'UTF-8');
feature('DefaultCharacterSet', 'GBK');
path = './China/';
China1=shaperead([path,'省.shp']);
China2=shaperead([path,'市.shp']);
China3=shaperead([path,'县.shp']);

idx1 = 0;
idx2 = [];
idx3 = [];

if ip.Results.Province ~= 0
    % Provincial  boundary infomation
    for i=1:length(China1)
        if strcmp(China1(i).x0xCA0xA1,ip.Results.Province), idx1=i;end
    end

    % Market boundary information
    for j=1:length(China2)
        if strcmp(China2(j).x0xCA0xA1,ip.Results.Province), idx2=[idx2,j];end
    end

    for k=1:length(China3)
        if strcmp(China3(k).x0xCA0xA1,ip.Results.Province), idx3=[idx3,k];end
    end
end


if ip.Results.global == 1
    % the whole china info
    plot([China1(:).X],[China1(:).Y],'color',[0.2 0.2 0.2],'linewidth',1.0); hold on
end


if  ip.Results.County ~= 0
% all of the city of the special Province
    plot([China3(idx3).X],[China3(idx3).Y],'color',[0.7,0.7,0.7],'linewidth',0.8); hold on
    set(gca,'Layer','top');
end

if  ip.Results.City ~= 0
% all of the city of the special Province
    plot([China2(idx2).X],[China2(idx2).Y],'color','k','linewidth',1); hold on
    set(gca,'Layer','top');
end

if ip.Results.Province ~= 0
    % the special Province
    plot([China1(idx1).X],[China1(idx1).Y],'color',[124, 0, 30]./255,'linewidth',1.5); hold on
end
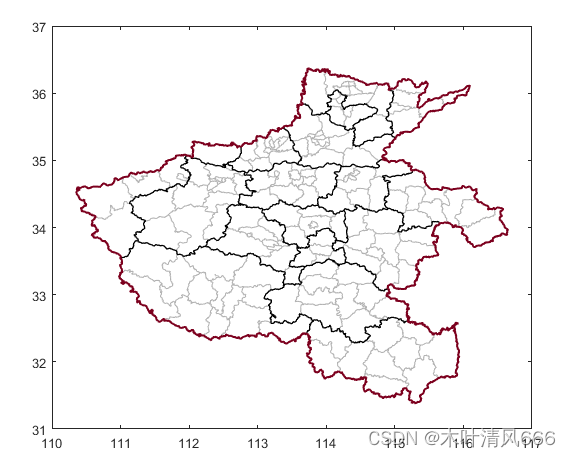
- 测试
set(gcf,'color','w','position',[0 0 800 1200])
axes('position', [0.2 0.2 0.6 0.4])
drawmap('Province','河南省','global',0,'city',1,'county',1)
drawmap更新2
- Matlab version == 2022a
function drawmap(varargin)

% drawmap: Add administrative region information for a specified province on the canvas
% use whith default configuration  -->  drawmap('湖北省')
% use whithout global map            -->  drawmap('湖北省', 'global', 0)

% ------------------------------------------------------------ %
% Author:             Muyeqingfeng
% e-mail address: muyeqingfeng@126.com
% Release date:    2023/05/05

ip = inputParser;
ip.addParamValue('global', 1)
ip.addParamValue('Province', 0);
ip.addParamValue('City', 0);
parse(ip,varargin{:});

% feature('DefaultCharacterSet', 'UTF-8');
% feature('DefaultCharacterSet', 'GBK');
path = '..\China\';
China1=shaperead([path,'省.shp']);
China2=shaperead([path,'市.shp']);

%{
matlab2016版本使用以下方式更改编码方式,就可以正常使用
feature('DefaultCharacterSet', 'UTF-8');
feature('DefaultCharacterSet', 'CBK');

但是2022版本好像不能解决上述问题,需要读取同路径下的dbf文件进行省份的匹配,然后作图
dbf也可以使用excel直接打开查看
%}
[num1,head1,text1] = xlsread("..\China\省.dbf");
[num2,head2,text2] = xlsread("..\China\市.dbf");

idx1 = 0;
idx2 = [];

if ip.Results.Province ~= 0
    % Provincial  boundary infomation
    sheng = text1(2:end,1);
    shi = text2(2:end,1);
    for i=1:length(sheng)
        if strcmp(sheng(i),ip.Results.Province), idx1=i;end
    end

    % Market boundary information
    for j=1:length(shi)
        if strcmp(shi(j),ip.Results.Province), idx2=[idx2,j];end
    end
end


if ip.Results.global == 1
    % the whole china info
    plot([China1(:).X],[China1(:).Y],'color',[0.2 0.2 0.2],'linewidth',1.0); hold on
end


if ip.Results.Province ~= 0
    % the special Province
    plot([China1(idx1).X],[China1(idx1).Y],'color','r','linewidth',1.5); hold on
end

if  ip.Results.City ~= 0
% all of the city of the special Province
    plot([China2(idx2).X],[China2(idx2).Y],'color','k','linewidth',0.8); hold on
    set(gca,'Layer','top');
end


 963
963


 被折叠的 条评论
为什么被折叠?
被折叠的 条评论
为什么被折叠?
 到【灌水乐园】发言


