Matlab代码
cmap = [69 117 180
116 173 203
171 217 233
254 224 144
253 174 77
244 109 67
215 48 39
165 0 38]/255;
figure
set(gcf,'outerposition',get(0,'screensize'))
ax = axes('Position',[0.2 0.2 0.6 0.6]);
h = colorbar;
map = colormap(jet);
colorbar_arrow(map,1,get(h,'position'),0.03)
xmin = -15; xmax = 25;
caxis([xmin xmax]);
x = 0.2; y = 0.05; w = 0.6; h = 0.03;
pos = [x y w h];
ax1 = axes('Position',pos);
[c,~] = size(cmap);
cdata = 2:c-1;
imagesc(cdata);
colormap(cmap(2:end-1,:));
box off
ax0 = axes('Position',get(gca,'Position'),'XAxisLocation','top','YAxisLocation','left',...
'Color','none','XColor','k','YColor','k');
set(ax1,'YTick', []);
set(ax0,'YTick', []);
set(ax0,'XTick', []);
box on
set(ax1,'XTick',0.5:c-1.5);
set(ax1,'XTicklabel',(xmin:5:xmax));
set(ax1,'FontSize',12, 'FontName','Arial');
ax1.TickLength = [h+0.005 0];
ax3 = axes('Position',[x-w/(c-2),y,w/(c-2),h],'YAxisLocation','right');
set(ax3,'ycolor','none','xcolor','none');
set(ax3,'XTick',[]);
fc = [1 2 3];
vt = [0 0.5;1 0.04;1 0.96;];
patch('Faces',fc,'Vertices',vt,'FaceColor',cmap(1,:),'EdgeColor',[0 0 0],'linewidth',0.01);
ax4 = axes('Position',[x+w,y,w/(c-2),h],'YAxisLocation','left');
set(ax4,'ycolor','none','xcolor','none');
set(ax4,'XTick',[]);
fc = [1 2 3];
vt = [1 0.5;0 0.96;0 0.04;];
patch('Faces',fc,'Vertices',vt,'FaceColor',cmap(end,:),'EdgeColor',[0 0 0],'linewidth',0.01);
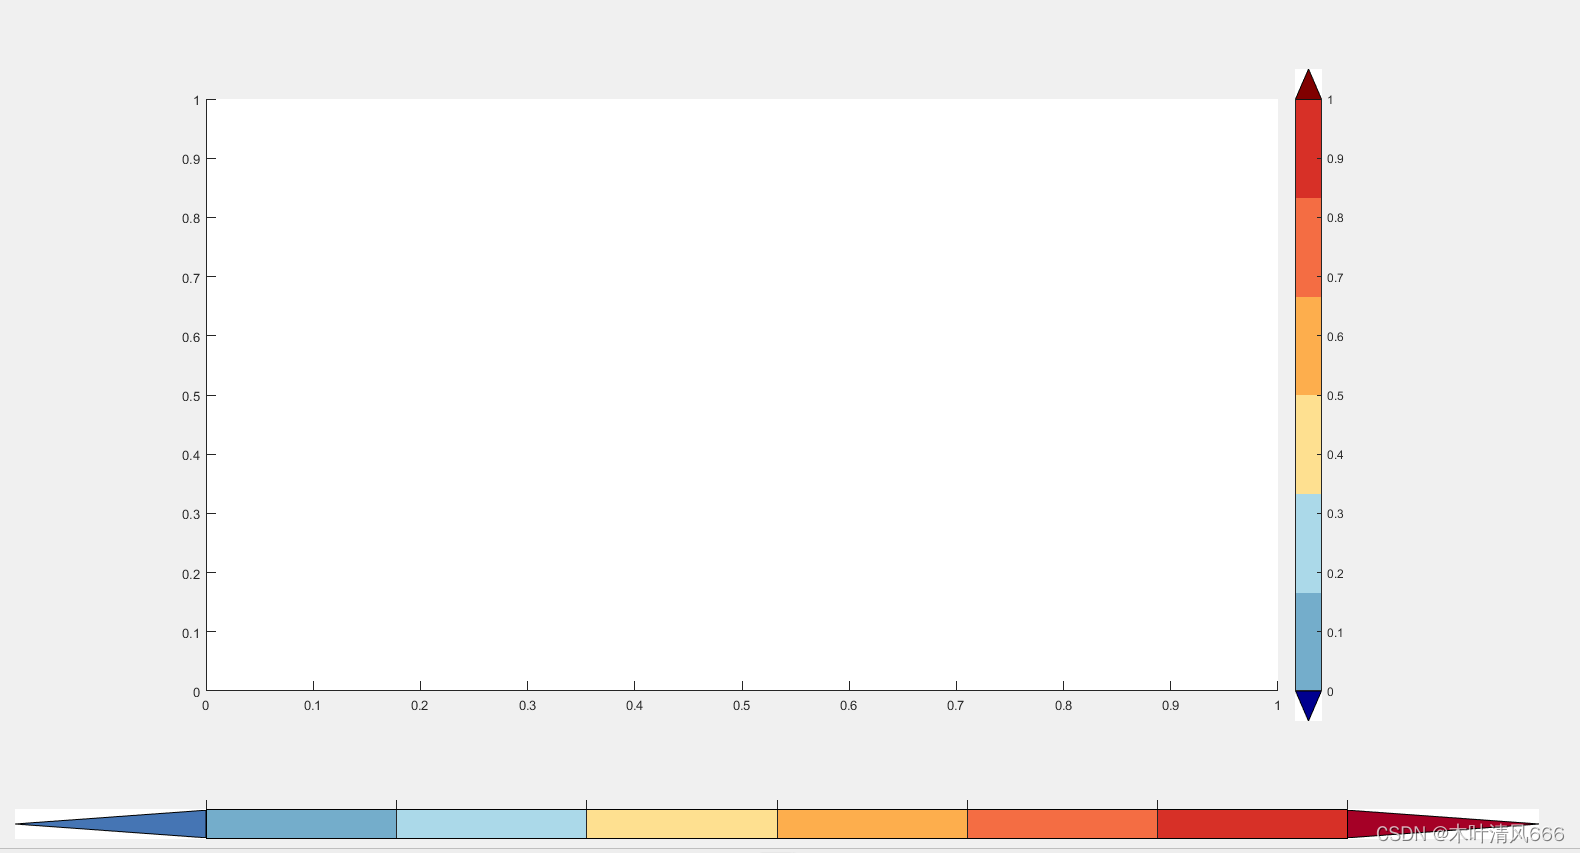
结果展示


 1万+
1万+


 被折叠的 条评论
为什么被折叠?
被折叠的 条评论
为什么被折叠?
 到【灌水乐园】发言


