


ELK基础日志收集
-
基于 logstash filter 功能将 nginx 默认的访问日志及 error log 转换为 json 格式并写入 elasticsearch
- 使用logstash的filter,利用正则进行合并,参考conf配置
-
input {
  file {
    path => "/apps/nginx/logs/access.log"
    type => "nginx-accesslog"
    stat_interval => "1"
    start_position => "beginning"
  }

  file {
    path => "/apps/nginx/logs/error.log"
    type => "nginx-errorlog"
    stat_interval => "1"
    start_position => "beginning"
  }

}

filter {
  if [type] == "nginx-accesslog" {
  grok {
    match => { "message" => ["%{IPORHOST:clientip} - %{DATA:username} \[%{HTTPDATE:request-time}\] \"%{WORD:request-method} %{DATA:request-uri} HTTP/%{NUMBER:http_version}\" %{NUMBER:response_code} %{NUMBER:body_sent_bytes} \"%{DATA:referrer}\" \"%{DATA:useragent}\""] }
    remove_field => "message"
    add_field => { "project" => "magedu"}
  }
  mutate {
    convert => [ "[response_code]", "integer"]
    }
  }
  if [type] == "nginx-errorlog" {
    grok {
      match => { "message" => ["(?<timestamp>%{YEAR}[./]%{MONTHNUM}[./]%{MONTHDAY} %{TIME}) \[%{LOGLEVEL:loglevel}\] %{POSINT:pid}#%{NUMBER:threadid}\: \*%{NUMBER:connectionid} %{GREEDYDATA:message}, client: %{IPV4:clientip}, server: %{GREEDYDATA:server}, request: \"(?:%{WORD:request-method} %{NOTSPACE:request-uri}(?: HTTP/%{NUMBER:httpversion}))\", host: %{GREEDYDATA:domainname}"]}
      remove_field => "message"
    }
  }
}

output {
  if [type] == "nginx-accesslog" {
    elasticsearch {
      hosts => ["192.168.182.31:9200"]
      index => "nginxlog2json-accesslog-%{+yyyy.MM.dd}"
      user => "eszja"
      password => "tigers"
  }}

  if [type] == "nginx-errorlog" {
    elasticsearch {
      hosts => ["192.168.182.31:9200"]
      index => "nginxlog2json-errorlog-%{+yyyy.MM.dd}"
      user => "eszja"
      password => "tigers"
  }}
}
-
基于 logstash 收集 json 格式的 nginx 访问日志
- 将nginx日志格式化,修改nginx配置文件,参考配置文件,指定日志格式并重新定义路径
-
root@es-node2:/home/zja# cat /apps/nginx/conf/nginx.conf | grep -v '#' | grep -v '^$' worker_processes 1; events { worker_connections 1024; } http { include mime.types; default_type application/octet-stream; log_format access_json '{"@timestamp":"$time_iso8601",' '"host":"$server_addr",' '"clientip":"$remote_addr",' '"size":$body_bytes_sent,' '"responsetime":$request_time,' '"upstreamtime":"$upstream_response_time",' '"upstreamhost":"$upstream_addr",' '"http_host":"$host",' '"uri":"$uri",' '"domain":"$host",' '"xff":"$http_x_forwarded_for",' '"referer":"$http_referer",' '"tcp_xff":"$proxy_protocol_addr",' '"http_user_agent":"$http_user_agent",' '"status":"$status"}'; access_log /var/log/nginx/access.log access_json; sendfile on; keepalive_timeout 65; server { listen 80; server_name localhost nginx.zja.com; location / { root html; index index.html index.htm; } error_page 500 502 503 504 /50x.html; location = /50x.html { root html; } } } -
nginx日志已经转换为json格式后,在logstash收集的时候,需要指定 codes => json
-
参考conf配置
-
input {
  file {
    path => "/var/log/nginx/access.log"
    type => "nginx-accesslog"
    stat_interval => "1"
    start_position => "beginning"
    codec => json
  }
}


output {
  if [type] == "nginx-accesslog" {
    elasticsearch {
      hosts => ["192.168.182.31:9200"]
      index => "nginxjsonlog-accesslog-%{+yyyy.MM.dd}"
      user => "eszja"
      password => "tigers"
  }}
}
-
-
基于 logstash 收集 java 日志并实现多行合并
- 同样使用正则匹配 合并日志
-
input {
  file {
    path => "/var/log/elasticsearch/my-es-cluster.log"
    type => "eslog"
    stat_interval => "1"
    start_position => "beginning"
    codec => multiline {
      # 匹配 例如 2022-12-01
      pattern => "^\[[0-9]{4}\-[0-9]{2}\-[0-9]{2}"
      negate => "true"
      what => "previous"
    }
  }
}

output {
  if [type] == "eslog" {
    elasticsearch {
      hosts =>  ["192.168.182.31:9200"]
      # ww 显示为今年的第几周
      index => "zja-eslog-%{+YYYY.ww}"
      user => "eszja"
      password => "tigers"
    }}
}
-
基于 logstash 收集 syslog 类型日志 (以 haproxy 替代网络设备)
- 安装haproxy测试
-
apt install -y haproxy
-
-
修改haproxy配置文件
-
/etc/haproxy/haproxy.cfg # 最后添加配置 listen kinana-5601 bind 192.168.182.33:5601 # 绑定的代理地址 mode http log global # inter 3 [每隔3s检查一次] fail 3[连续检查3次失败剔除] rise 3 [连续成功3次加入] server kinina-server1 192.168.182.31:5601 check inter 3 fail 3 rise 3 -
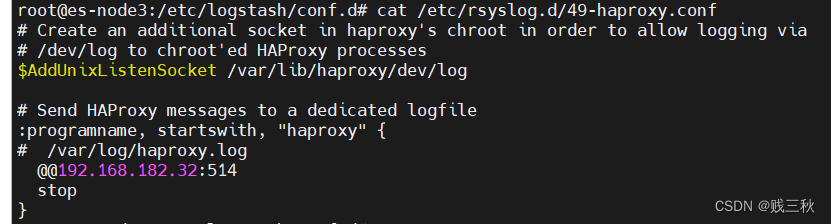
修改haproxy日志输出
/etc/rsyslog.d/49-haproxy.conf #原日志地址=> /var/log/haproxy.log #修改为logstash服务器以及对应的监听端口 ==> @@192.168.182.32:514 -
-
重启resyslog 使配置生效
-
systemctl restart rsyslog.service
-
-
使用logstash日志收集插件 syslog 模块[默认监听514,也可以监听其他端口获取不同的服务日志]
-
input{
  syslog {  # 使用syslog 模块
    type => "rsyslog-haproxy"
    host => "0.0.0.0"  # 默认监听本机,该配置可以忽略
    port => "514"  #监听一个本地的端口
}}

output{
  if [type] == "rsyslog-haproxy" {
    elasticsearch {
      hosts =>  ["192.168.182.31:9200"]
      index => "zja-%{type}-%{+YYYY.ww}"
      user => "eszja"
      password => "tigers"
    }}
}
-
-
- 安装haproxy测试
-
logstash 收集日志并写入 Redis、再通过其它 logstash 消费至 elasticsearch 并保持 json 格式日志的解析
- 实现路径 log =(logstash input)=> Redis ==> logstash ==> elasticsearch ==> kinana
- 虚拟机安装redis
-
apt install redis -y -
配置密码
-
/etc/redis/redis.conf
requirepass tiger
-
-
-
通过logstash收集日志先写入redis
-
参考配置 logs2redis
-
input {
  file {
    # 已经格式化json,不需再经过fileter
    path => "/var/log/nginx/access.log"
    type => "nginx-accesslog"
    stat_interval => "1"
    start_position => "beginning"
    codec => "json"  # json解析
  }

  file {
    path => "/apps/nginx/logs/error.log"
    type => "nginx-errorlog"
    stat_interval => "1"
    start_position => "beginning"
  }

}

filter {
  # if [type] == "nginx-accesslog" {
  # grok {
  #   match => { "message" => ["%{IPORHOST:clientip} - %{DATA:username} \[%{HTTPDATE:request-time}\] \"%{WORD:request-method} %{DATA:request-uri} HTTP/%{NUMBER:http_version}\" %{NUMBER:response_code} %{NUMBER:body_sent_bytes} \"%{DATA:referrer}\" \"%{DATA:useragent}\""] }
  #   remove_field => "message"
  #   add_field => { "project" => "magedu"}
  # }
  # mutate {
  #   convert => [ "[response_code]", "integer"]
  #   }
  # }
  if [type] == "nginx-errorlog" {
    grok {
      match => { "message" => ["(?<timestamp>%{YEAR}[./]%{MONTHNUM}[./]%{MONTHDAY} %{TIME}) \[%{LOGLEVEL:loglevel}\] %{POSINT:pid}#%{NUMBER:threadid}\: \*%{NUMBER:connectionid} %{GREEDYDATA:message}, client: %{IPV4:clientip}, server: %{GREEDYDATA:server}, request: \"(?:%{WORD:request-method} %{NOTSPACE:request-uri}(?: HTTP/%{NUMBER:httpversion}))\", host: %{GREEDYDATA:domainname}"]}
      remove_field => "message"
    }
  }
}

output {
  if [type] == "nginx-accesslog" {
    redis {
      data_type => "list"
      key => "zja-%{type}"
      host => "192.168.182.33"
      port => "6379"
      db => "0"
      password => "tiger"
    }}

  if [type] == "nginx-errorlog" {
    redis {
      data_type => "list"
      key => "zja-%{type}"
      host => "192.168.182.33"
      port => "6379"
      db => "0"
      password => "tiger"
    }}
}
-
-
logstash通过redis消费日志,然后传递给elasticsearch
-
参考redis2logstash-es.conf
-
input {
    redis {
      data_type => "list"
      key => "zja-nginx-accesslog"
      host => "192.168.182.33"
      port => "6379"
      db => "0"
      password => "tiger"
      codec => "json"  #json解析
    }
    redis {
      data_type => "list"
      key => "zja-nginx-errorlog"
      host => "192.168.182.33"
      port => "6379"
      db => "0"
      password => "tiger"
      codec => "json"  #json解析
    }
}

output {
  if [type] == "nginx-accesslog" {
    elasticsearch {
      hosts => ["192.168.182.31:9200"]
      index => "redis-nginx-accesslog-2-%{+yyyy.MM.dd}"
      user => "eszja"
      password => "tigers"
    }
    # stdout {}
  }

  if [type] == "nginx-errorlog" {
    elasticsearch {
      hosts => ["192.168.182.31:9200"]
      index => "redis-nginx-errorlog-2-%{+yyyy.MM.dd}"
      user => "eszja"
      password => "tigers"
  }}
}
-
-
-
基于 docker-compose 部署单机版本 ELK
(扩展)大型的日志收集案例: filebeat–>logstash–>Redis<–logstash–>elasticsearch
-
通过filebeat【几十M】收集日志(logstash太重了【几百M】)
filebeat 可以在服务器或者容器内(不支持日志做处理,例如转为json格式)
log =(filebeat input) => logstash => Redis ==> logstash ==> elasticsearch ==> kinana-
这里面主要涉及的三个配置文件
-
# 配置filebeat日志收集路径以及output方向
/etc/filebeat/filebeat.yml

# logstash获取filebeat传递的日志,并将日志保存至redis
/etc/logstash/conf.d/filebeat2logst2redis.conf

# logstash消费redis日志并写入elasticsearch
/etc/logstash/conf.d/redis-logs-es.conf
-
-
安装filebea
-
dpkg -i /home/zja/filebeat-8.5.1-amd64.deb
-
-
修改filebeat配置文件
-
filebeat.inputs:
- type: filestream
  id: magedu-app1
  enabled: true
  paths:
    - /var/log/nginx/access.log
  fields:
    project: magedu
    type: magedu-app1-accesslog
- type: filestream
  id: magedu-app1
  enabled: true
  paths:
    - /apps/nginx/logs/error.log
  fields:
    project: magedu
    type: magedu-app1-errorlog
filebeat.config.modules:
  path: ${path.config}/modules.d/*.yml
  reload.enabled: false
setup.template.settings:
  index.number_of_shards: 1
setup.kibana:
output.logstash:
  enabled: true
  hosts: ["192.168.182.33:5046"]
  loadbalance: true
  worker: 1
  compression_level: 3
processors:
  - add_host_metadata:
      when.not.contains.tags: forwarded
  - add_cloud_metadata: ~
  - add_docker_metadata: ~
  - add_kubernetes_metadata: ~

# output 2 redis
#output.redis:
#  hosts: ["192.168.182.33:6379"]
#  password: "tiger"
#  key: "filebeat-nginx-access"
#  db: 1
#  timeout: 5
-
-
/etc/logstash/conf.d/filebeat2logst2redis.conf
-
input {
  beats {
    # filebeat 向logstash发送日志的端口 5046 【filebeat.yml 配置文件中】
    port => 5046
    codec => "json"
  }
}


output {

  # 测试
  #stdout {
  #  codec => "rubydebug"
  #}
  # ===========================

  if [fields][type] == "magedu-app1-accesslog" {
    redis {
      host => "192.168.182.33"
      password => "tiger"
      port => "6379"
      db => "2"
      key => "magedu-app1-accesslog"
      data_type => "list"
     }
    # stdout {}
  }
  if [fields][type] == "magedu-app1-errorlog" {
  redis {
    host => "192.168.182.33"
    password => "tiger"
    port => "6379"
    db => "2"
    key => "magedu-app1-errorlog"
    data_type => "list"
     }
  }
}
-
-
/etc/logstash/conf.d/redis-logs-es.conf
-
input {
    redis {
      data_type => "list"
      key => "magedu-app1-accesslog" # 在filebeat.yml 定义的type
      host => "192.168.182.33"
      port => "6379"
      db => "2"
      password => "tiger"
      codec => "json"  #json解析
    }
    redis {
      data_type => "list"
      key => "magedu-app1-errorlog"  # 在filebeat.yml 定义的type
      host => "192.168.182.33"
      port => "6379"
      db => "2"
      password => "tiger"
      codec => "json"  #json解析
    }
}

output {
  # 注意添加 [fields] 这也是在filebeat.yml中定义的
  if [fields][type] == "magedu-app1-accesslog" {
    elasticsearch {
      hosts => ["192.168.182.31:9200"]
      index => "filebeat-magedu-app1-accesslog-%{+yyyy.MM.dd}"
      user => "eszja"
      password => "tigers"
    }
    # stdout {}
  }

  if [fields][type] == "magedu-app1-errorlog" {
    elasticsearch {
      hosts => ["192.168.182.31:9200"]
      index => "filebeat-magedu-app1-errorlog-%{+yyyy.MM.dd}"
      user => "eszja"
      password => "tigers"
    }
    # stdout {}
  }
}
-
-
-
日志写入MySQL数据库
- 安装数据库
- 创建用户并授权
- 创建表
-
create  table t_logstash (
    id int primary key auto_increment,
    host varchar(512),
    clientip varchar(128),
    resplonsetime float,
    status int(32),
    uri varchar(512),
    http_user_agent varchar (512),
    time timestamp default CURRENT_TIMESTAMP
);
-
-
为logstash安装 logstash-output-jdbc 插件
-
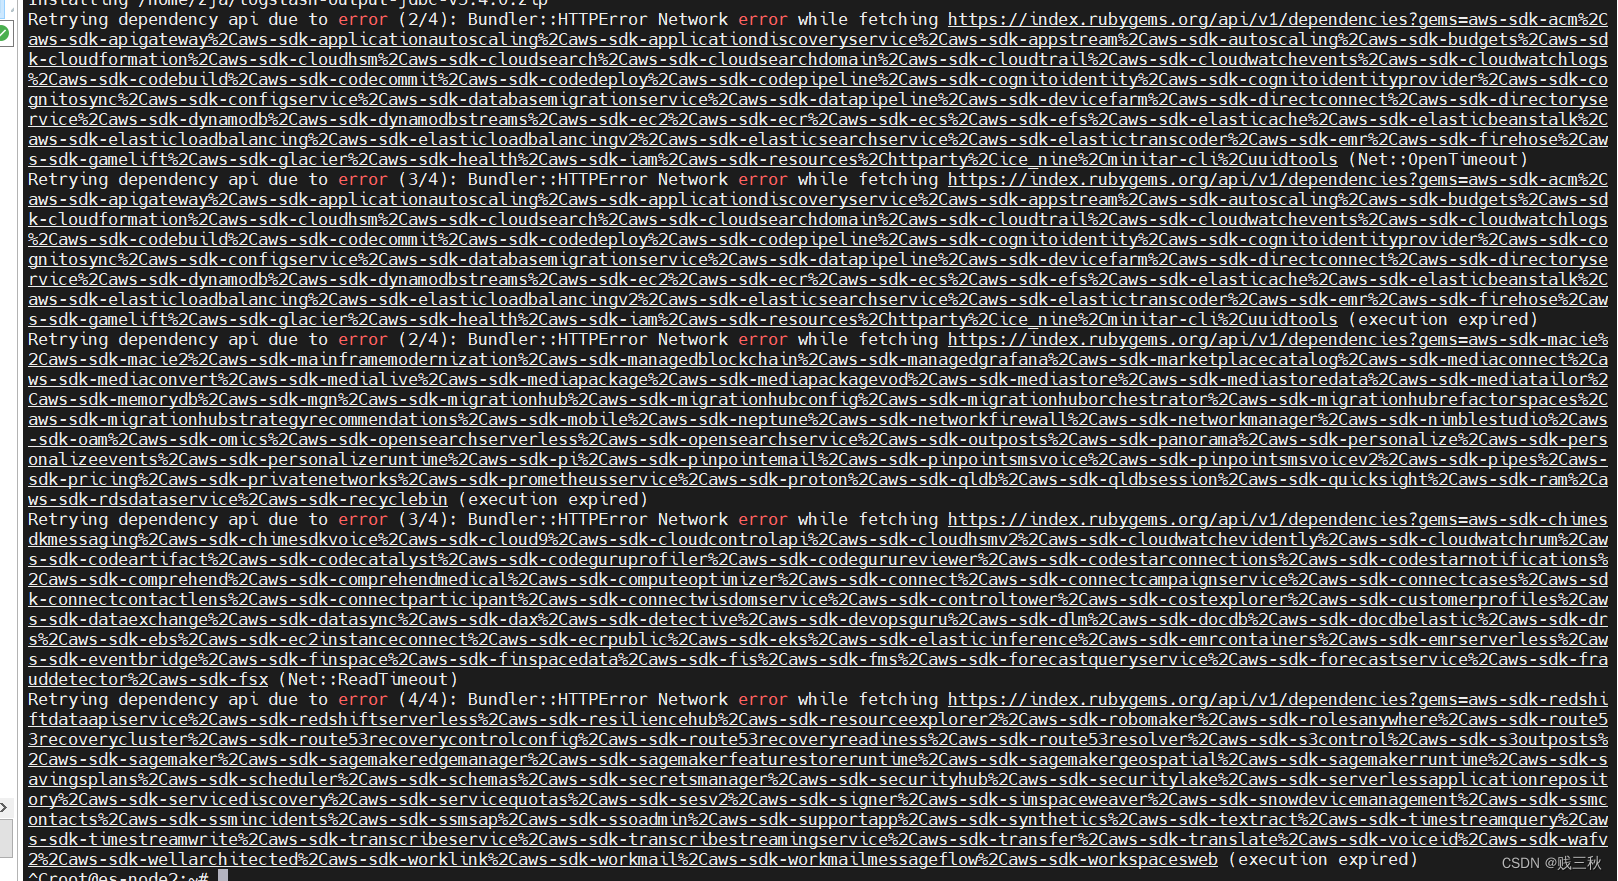
直接安装会超时,再安装还是超时 (过)
-
/usr/share/logstash/bin/logstash-plugin install logstash-output-jdbc
-
-
-
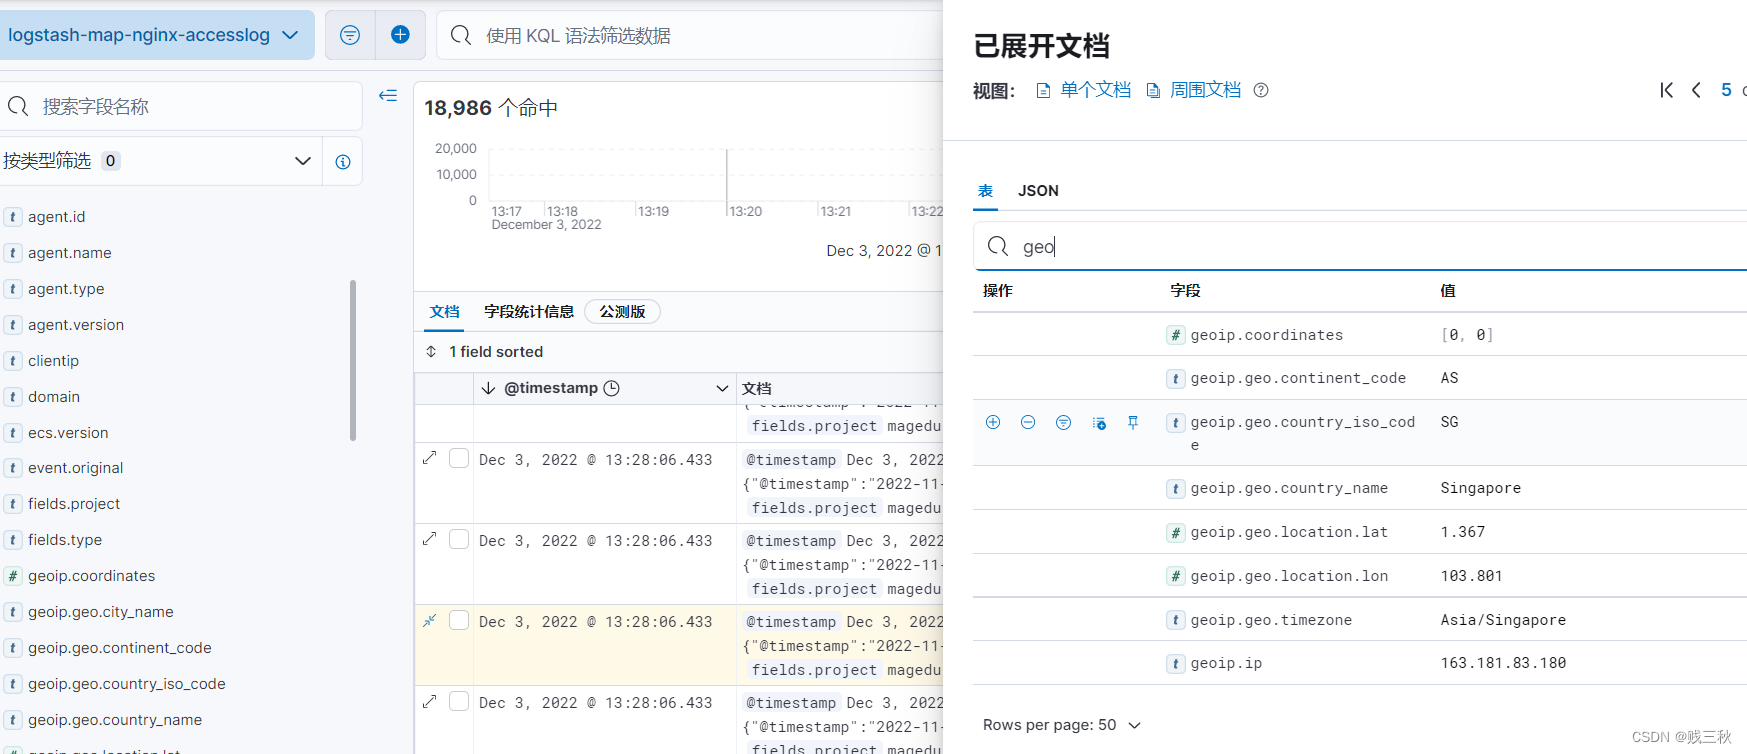
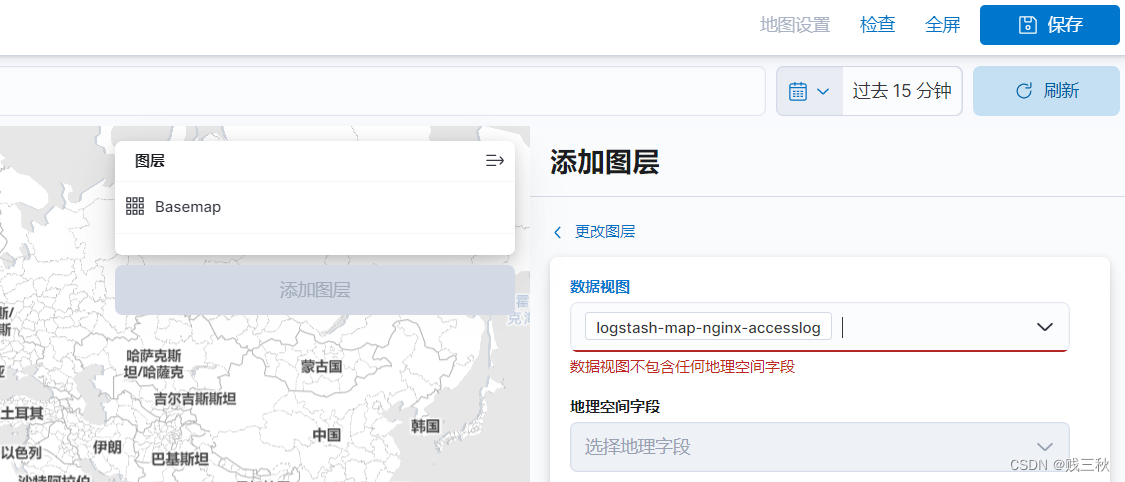
地图显示客户端 IP 城市
- 日志具有geoip信息,但是添加图层显示没有空间字段
- 日志具有geoip信息,但是添加图层显示没有空间字段
-
logstash 收集 TCP 日志


 8043
8043


 被折叠的 条评论
为什么被折叠?
被折叠的 条评论
为什么被折叠?
 到【灌水乐园】发言


