


 本文档提供了在CentOS7上安装ELK(Elasticsearch, Logstash, Kibana)8.x版本和Filebeat的详细步骤,包括每个组件的下载、配置和启动。重点涵盖了如何配置Elasticsearch的yml文件以允许外部访问,Kibana的安装与设置,Logstash的配置以解析Nginx和PM2日志,以及Filebeat的配置来收集日志。"
103938708,6653130,解决Python使用Stanford CoreNLP端口加载错误,"['Python', '自然语言处理', 'bug']
本文档提供了在CentOS7上安装ELK(Elasticsearch, Logstash, Kibana)8.x版本和Filebeat的详细步骤,包括每个组件的下载、配置和启动。重点涵盖了如何配置Elasticsearch的yml文件以允许外部访问,Kibana的安装与设置,Logstash的配置以解析Nginx和PM2日志,以及Filebeat的配置来收集日志。"
103938708,6653130,解决Python使用Stanford CoreNLP端口加载错误,"['Python', '自然语言处理', 'bug']
centos7 yum安装ELK8.X+filebeat
环境版本
| 系统 | elasticsearch kibana logstash filebeat |
|---|---|
| centos7.9 | 8.5.3 8.5.3 8.5.3 8.5.3 |
一、ELK下载路径
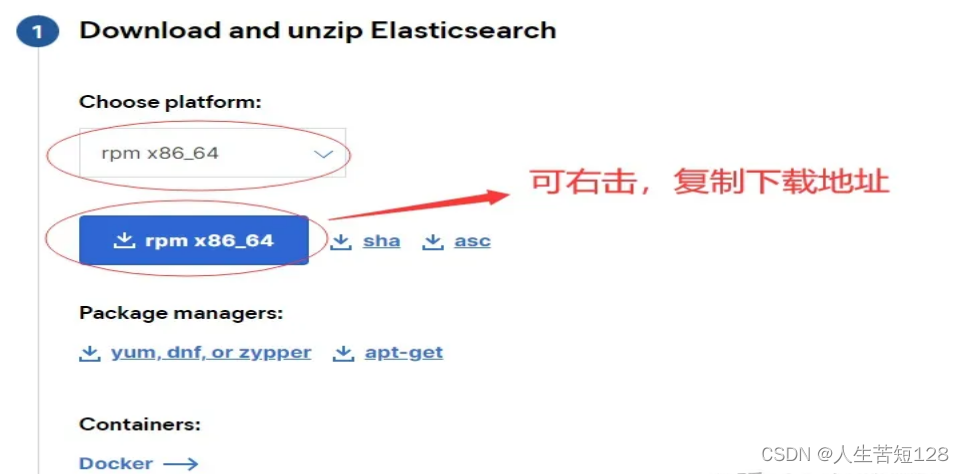
(一)下载地址:Elastic官网
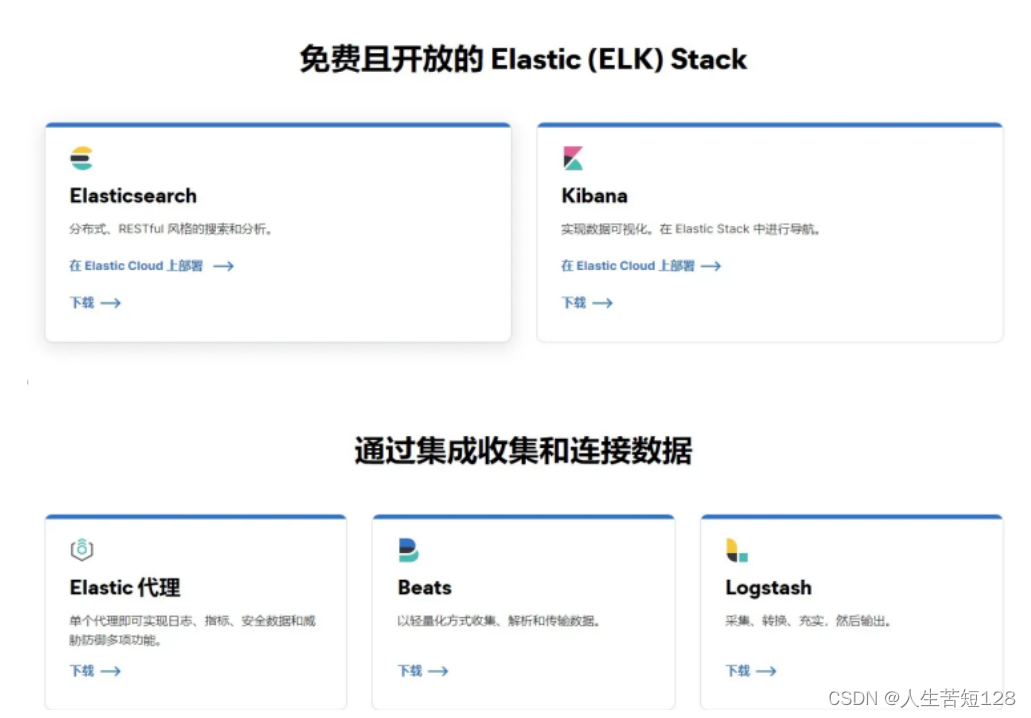
我下载的是rpm格式
(二)Wget下载
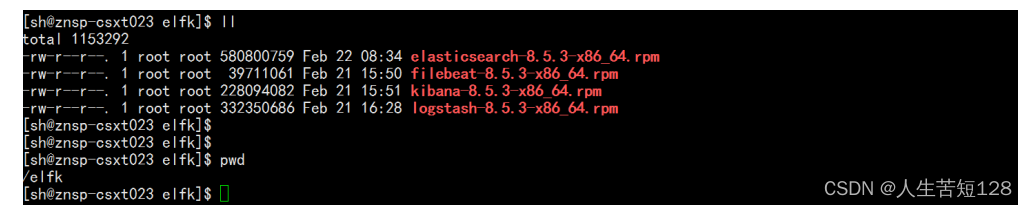
在ssh工具上,可以通过wget 命令将4个rpm包进行下载
wget https://artifacts.elastic.co/downloads/elasticsearch/elasticsearch-8.5.3-x86_64.rpm
wget https://artifacts.elastic.co/downloads/kibana/kibana-8.5.3-x86_64.rpm
wget https://artifacts.elastic.co/downloads/logstash/logstash-8.5.3-x86_64.rpm
wget https://artifacts.elastic.co/downloads/beats/filebeat/filebeat-8.5.3-x86_64.rpm
下载的包就放在/elfk下,如
二、elasticsearch 安装配置
(一)elasticsearch 安装
使用yum localinstall 安装本地rpm包,执行代码如下(示例):
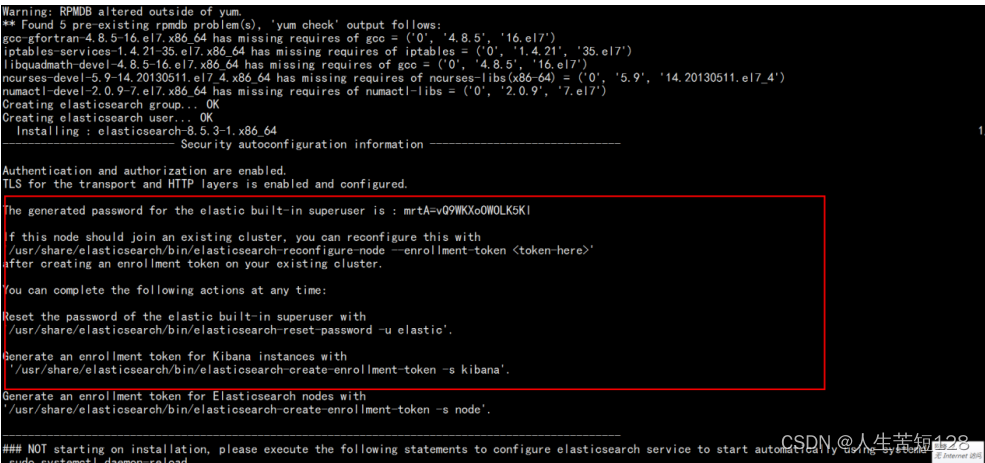
yum localinstall elasticsearch-8.5.3-x86_64.rpm
安装完成会生成默认密码,可以记录下,登录kibana时需要
(二)配置elasticsearch.yml文件
配置elasticsearch.yml文件:
vi /etc/elasticsearch/elasticsearch.yml
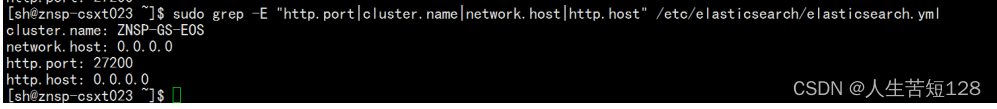
把配置文件中如下几个更改或添加,并打开注释,如下
cluster.name: wxxya-es
http.port: 9200
network.host: 0.0.0.0
http.host: 0.0.0.0
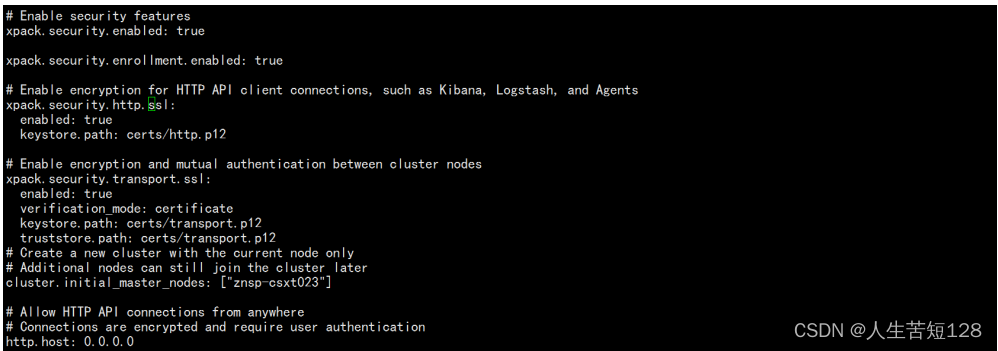
elasticsearch8中多了sslt和安全中心,xpack版块是安装自动生成的不用管
如果想使用http打开将xpack.security.http.ssl下面的enabled改为false
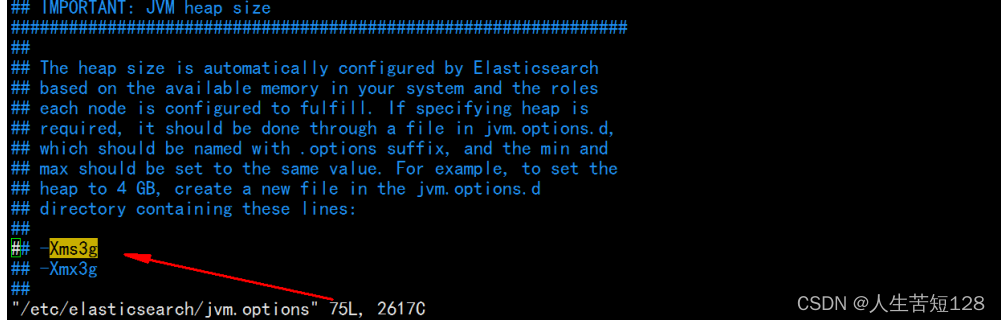
(三)配置jvm.options文件,设置es占用系统内存大小
vi /etc/elasticsearch/jvm.options
我这当前设置最大小为3g
-Xms3g
-Xmx3g
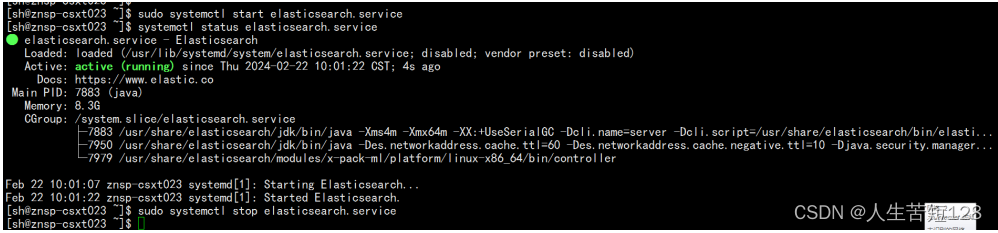
(四)elasticsearch运行
启动停止
sudo systemctl start elasticsearch.service
sudo systemctl stop elasticsearch.service
开机自启
sudo /bin/systemctl daemon-reload
sudo /bin/systemctl enable elasticsearch.service
查看elasticsearch启动日志,选其一就行
journalctl --unit elasticsearch
systemctl status elasticsearch.service
例:
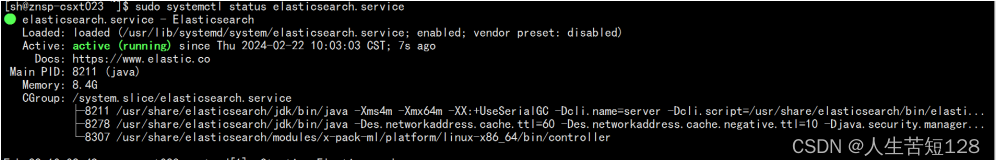
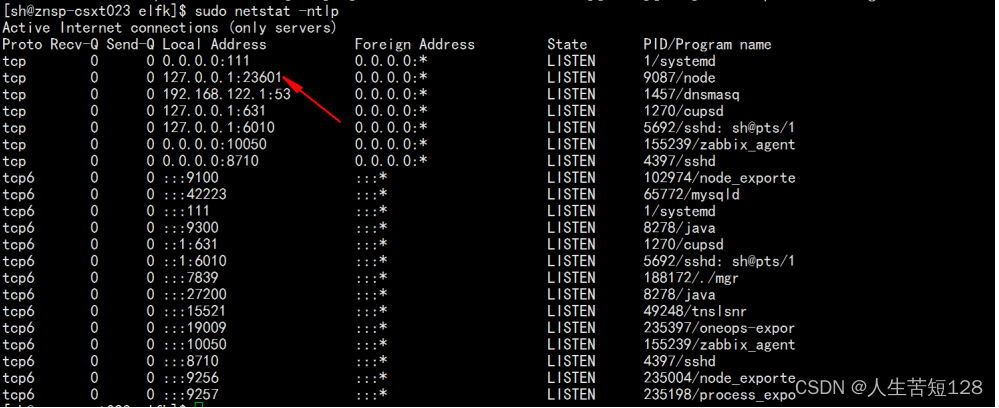
查看端口是否启动,8.x使用curl请求9200,返回:curl: (52) Empty reply from server,必须是https请求。
netstat -ntlp
curl http://localhost:9200

三、Kibana 安装配置
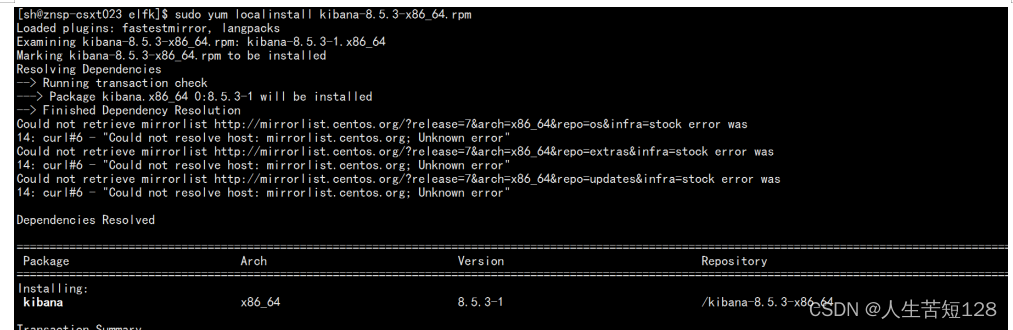
(一)Kibana 安装
使用yum localinstall 安装本地rpm包,执行代码如下(示例):
yum localinstall kibana-8.5.3-x86_64.rpm
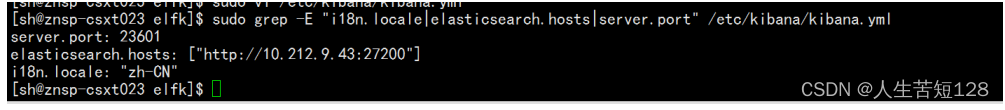
(二)配置kibana.yml文件
vi /etc/kibana/kibana.yml
把配置文件中kibana改成中文,设置自己本机IP,其它不变。如下
i18n.locale: “zh-CN”
elasticsearch.hosts: [‘https://172.24.67.40:9200’]
(三)kibana运行,与es一致名称改一下就行
启动停止
sudo systemctl start kibana.service
sudo systemctl stop kibana.service
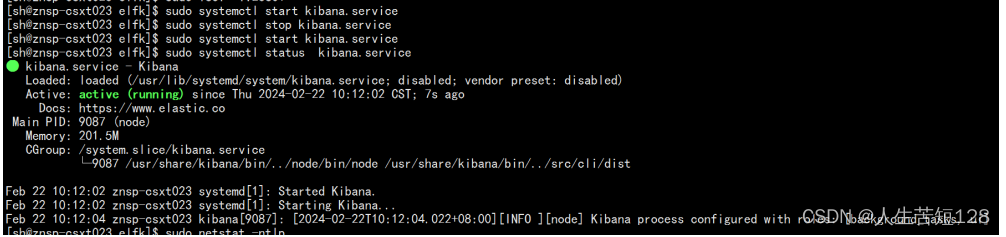
查看5601商品是否启动
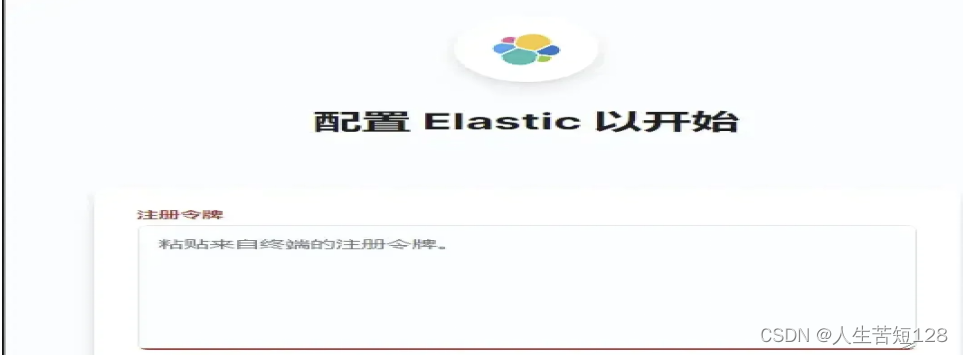
(四)打开浏览器http://ip:5601,使用elastic用户的密码进行认证
第一次访问改链接的时候需要填入令牌,令牌就是第一次启动elasticsearch时保存的信息中的token,注意这个token只有30分钟的有效期,如果过期了只能进入容器重置token
重置token:进入容器执行
/usr/share/elasticsearch/bin/elasticsearch-create-enrollment-token -s kibana --url “https://127.0.0.1:9200”
输入token以后会看到一个验证码框,验证码从kibana的日志中获取
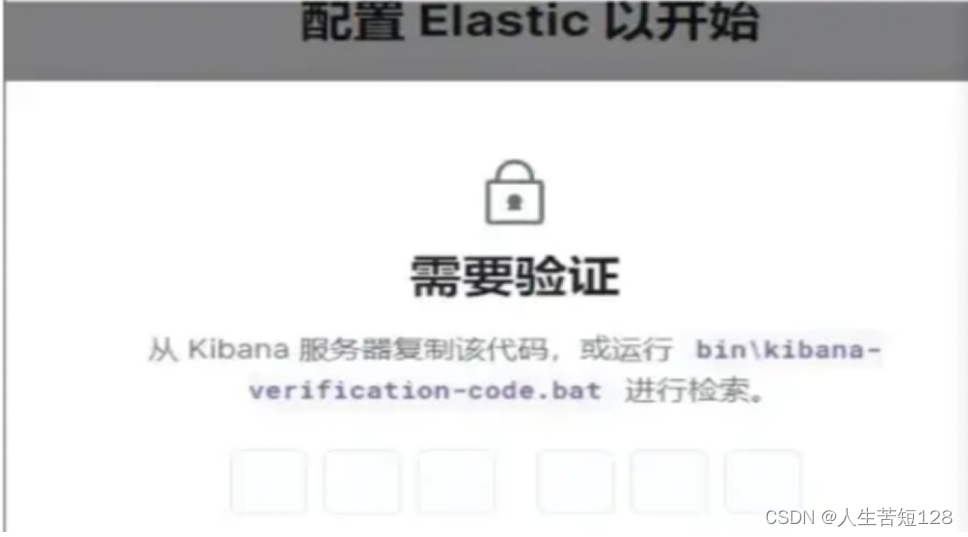
生成验证码
/usr/share/kibana/bin/kibana-verification-code
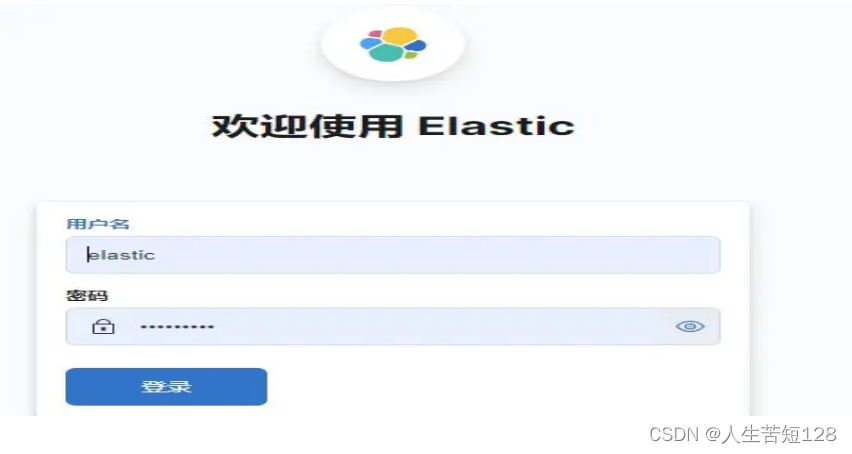
输入用户名:elastic,密码:es安装时记录的密码
四、logstash 安装配置
(一)logstash 安装
使用yum localinstall 安装本地rpm包,执行代码如下(示例):
yum localinstall logstash-8.5.3-x86_64.rpm
(二)配置logstash.yml文件
vi /etc/logstash/logstash.yml
在kibana.yml文件中增加了
http.host: “0.0.0.0”
http.port: 9600-9700
更改startup.options文件,设置为root用户权限
LS_USER=root
LS_GROUP=root
创建一个logstash.conf配置文件,我这是配置nginx日志和pm2日志,nginx日志格式也得配置一下
vi /etc/logstash/conf.d/logstash.conf
logstash.conf内容如下
Sample Logstash configuration for creating a simple
Beats -> Logstash -> Elasticsearch pipeline.
input {
beats {
port => 4567
}
file {
path => “/var/log/nginx/access.log”
type => “nginx-accesslog”
stat_interval => “1”
start_position => “beginning”
}
file {
path => “/var/log/nginx/error.log”
type => “nginx-errorlog”
stat_interval => “1”
start_position => “beginning”
}
}
filter {
if [type] == “nginx-accesslog” {
grok {
match => { “message” => [“%{IPORHOST:clientip} - %{DATA:username} [%{HTTPDATE:request-time}] “%{WORD:request-method} %{DATA:request-uri} HTTP/%{NUMBER:http_version}” %{NUMBER:response_code} %{NUMBER:body_sent_bytes} “%{DATA:referrer}” “%{DATA:useragent}””] }
remove_field => “message”
add_field => { “project” => “magedu”}<
 最低0.47元/天 解锁文章


 740
740

 被折叠的 条评论
为什么被折叠?
被折叠的 条评论
为什么被折叠?
 到【灌水乐园】发言


