


主要设置X轴的参数
SharedPointer<QCPAxisTickerTime> timeTicker(new QCPAxisTickerTime);
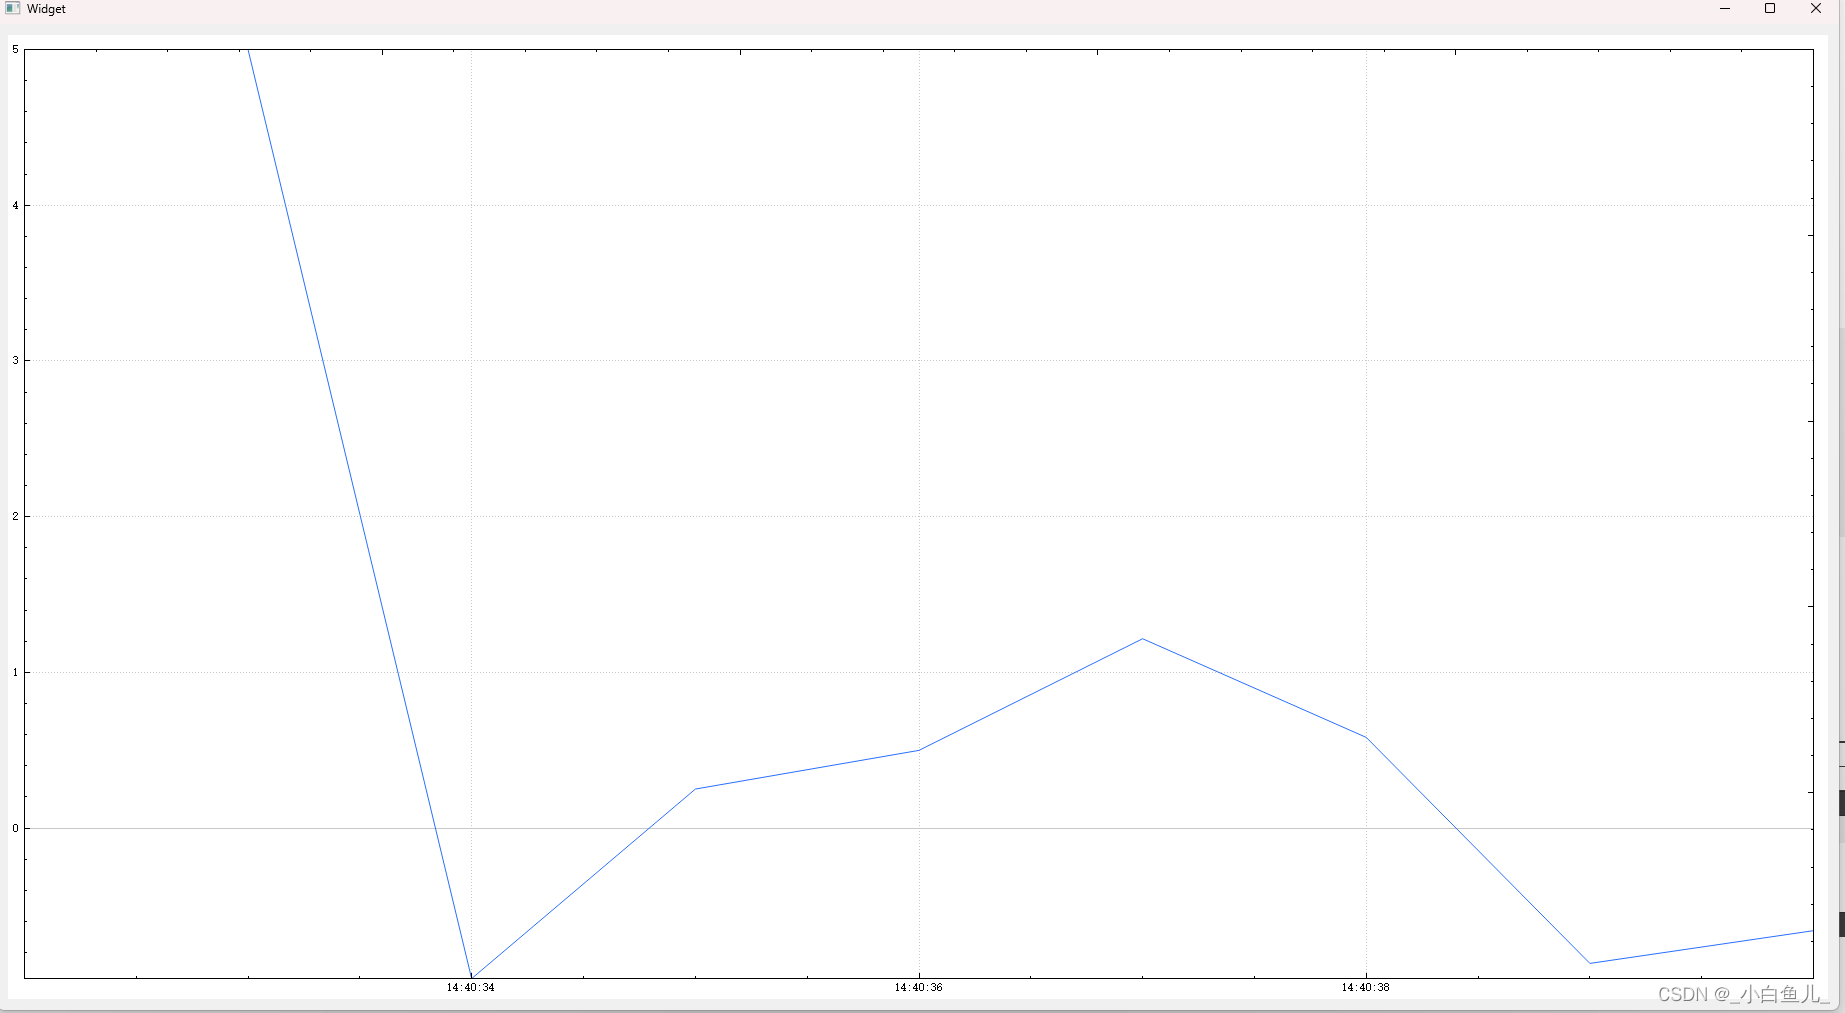
timeTicker->setTimeFormat("%h:%m:%s");
demo如下
Widget::Widget(QWidget *parent)
    : QWidget(parent)
    , ui(new Ui::Widget)
{
    ui->setupUi(this);

    dataTimer = new QTimer(this);

    //注意ui->widget 是我的customplot类
    ui->widget->addGraph();
    ui->widget->graph(0)->setPen(QPen(QColor(40, 110, 255)));

    //设置x轴格式
    QSharedPointer<QCPAxisTickerTime> timeTicker(new QCPAxisTickerTime);
    timeTicker->setTimeFormat("%h:%m:%s");
    ui->widget->xAxis->setTicker(timeTicker);
    ui->widget->axisRect()->setupFullAxesBox();
    ui->widget->yAxis->setRange(-1, 1);

    int nowtime = (QTime::currentTime().hour()*60+QTime::currentTime().minute())*60+QTime::currentTime().second();

    //设置x轴为当前时间
    ui->widget->xAxis->setRange(nowtime-5,nowtime);
    ui->widget->graph(0)->addData(nowtime, 5);

    connect(dataTimer, &QTimer::timeout, this, &Widget::realtimeDataSlot);
    dataTimer->start(500);
}

Widget::~Widget()
{
    delete ui;
}

int Widget::realtimeDataSlot()
{
    static QTime timeStart = QTime::currentTime();
    double key = timeStart.msecsTo(QTime::currentTime()) / 1000.0;
    static double lastPointKey = 0;
    if (key - lastPointKey > 0.002)
    {
        ui->widget->graph(0)->addData(key, qSin(key) + std::rand() / (double)RAND_MAX * 1 * qSin(key / 0.3843));
        lastPointKey = key;
    }
    ui->widget->graph(0)->rescaleValueAxis();
    ui->widget->xAxis->setRange(key, 8, Qt::AlignRight);
    ui->widget->replot();
    return 0;
}


 2389
2389


 被折叠的 条评论
为什么被折叠?
被折叠的 条评论
为什么被折叠?
 到【灌水乐园】发言


