


逻辑回归预测泰坦尼克号乘客生存率
描述
RMS泰坦尼克号的沉没是历史上最臭名昭着的沉船之一。1912年4月15日,在她的处女航中,泰坦尼克号在与冰山相撞后沉没,在2224名乘客和机组人员中造成1502人死亡。这场耸人听闻的悲剧震惊了国际社会,并导致了更好的船舶安全规定。
造成海难失事的原因之一是乘客和机组人员没有足够的救生艇。尽管幸存下沉有一些运气因素,但有些人比其他人更容易生存,比如女人,孩子和上流社会。
在这个挑战中,我们要完成对哪些人可能存活的分析。特别是,我们要运用机器学习工具来预测哪些乘客幸免于悲剧。
本任务将采用机器学习算法逻辑回归来实现泰坦尼克号乘客生存率的预测,任务包含数据获取,数据分析,缺失数据处理,特征工程,拆分数据集,建立模型,预测,模型评估等。
环境
-
操作系统:Windows 10
-
工具软件:Anaconda3 2019、Python3.6、Jupyter Notebook
-
硬件环境:无特殊要求
-
依赖库列表
scikit-learn 0.24.2
分析
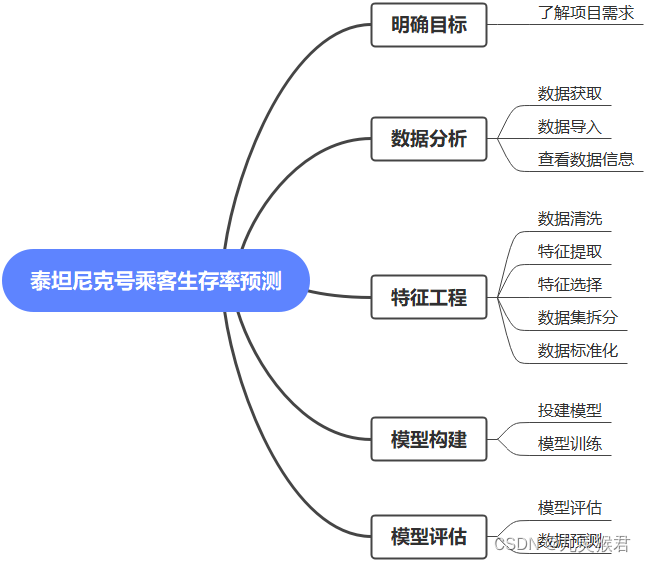
《逻辑回归预测泰坦尼克号乘客生存率》涉及以下环节:
实施
1、明确目标
数据分析的目的取决于项目需求,脱离了实际项目需求的数据分析就是无源之水,所以第一步就是明确分析的目标是什么。
本次项目是著名的泰坦尼克号沉船事件,这里想知道影响沉船生存率的因素是什么,并且预测乘客的的生存率。
2、数据分析
2.1 数据获取
可以从项目官网下载泰坦尼克号乘客数据集:https://www.kaggle.com/c/titanic/data
训练集数据为:train.csv 测试集数据为:test.csv
本任务已经提供数据集,无需重复下载。
2.2 数据导入
打开Jupyter Notebook,创建文件“逻辑回归预测泰坦尼克号乘客生存率.ipynb”,将下载的数据集文件放在和代码相同目录,输入如下代码,导入数据:
import pandas as pd # 导入pandas库
import numpy as np  # 导入numpy库

df_titanic = pd.read_csv('../dataset/train.csv')  # 读取文件
print("训练集数据:", df_titanic.shape)   # 查看训练数据集行列数
df_titanic.head()                      # 显示前5行数据
实验结果:
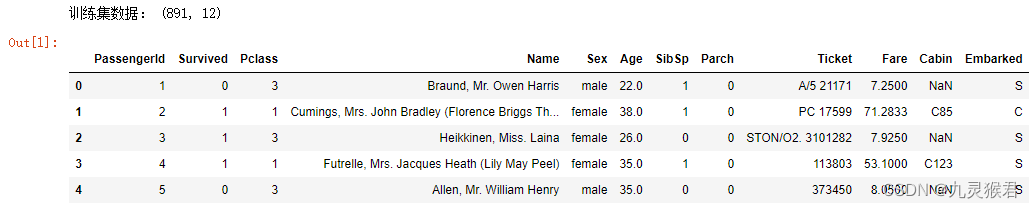
各数据字段含义:
- PassengerId:乘客唯一识别id
- Survived:是否存活,0为否,1为是
- Pclass:船舱等级,1、2、3等
- Name:姓名
- Sex:性别
- Age:年龄
- SibSp:和该乘客一起旅行的兄弟姐妹和配偶的数量
- Parch:和该乘客一起旅行的父母和孩子的数量
- Ticket:船票号
- Fare:船票价格
- Cabin:船舱号
- Embarked:登船港口 S=英国南安普顿Southampton(起航点) C=法国 瑟堡市Cherbourg(途经点) Q=爱尔兰 昆士Queenstown(途经点)
2.3 查看数据信息
# 缺失值查询
df_titanic.isnull().sum()
输出结果:
PassengerId      0
Survived         0
Pclass           0
Name             0
Sex              0
Age            177
SibSp            0
Parch            0
Ticket           0
Fare             0
Cabin          687
Embarked         2
dtype: int64
可以看到Age有177个缺失值,Cabin有687个缺失值,Embarked有2个缺失值。
3、特征工程
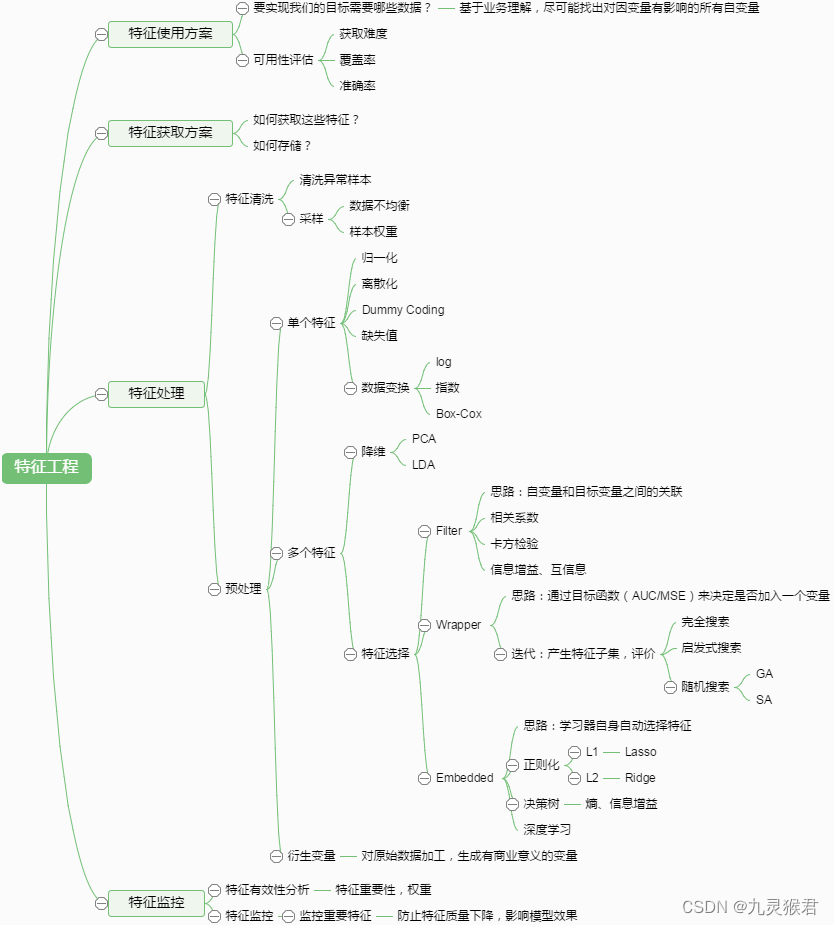
特征工程是机器学习中不可或缺的一部分,在机器学习领域中占有非常重要的地位。特征工程,是指用一系列工程化的方式从原始数据中筛选出更好的数据特征,以提升模型的训练效果。业内有一句广为流传的话是:数据和特征决定了机器学习的上限,而模型和算法是在逼近这个上限而已。由此可见,好的数据和特征是模型和算法发挥更大的作用的前提。特征工程通常包括数据预处理、特征选择、降维等环节。如下图所示:
3.1 数据清洗
Age缺失值较多,我们可以用均值去填充Age的缺失值,Embarked为分类型数据,一般用众数填充。这里对Cabin不做处理,因为Cabin是对模型训练影响较小的数据特征,我们可以忽略这个特征的存在,后面的操作中,需要将这些不相关特征剔除掉。Age均值数据填充代码如下:
df_titanic['Age'] = df_titanic['Age'].fillna(df_titanic['Age'].mean())  # 使用均值数据填充年龄特征
df_titanic.isnull().sum()
实验结果:
PassengerId      0
Survived         0
Pclass           0
Name             0
Sex              0
Age              0
SibSp            0
Parch            0
Ticket           0
Fare             0
Cabin          687
Embarked         2
dtype: int64
可以看到年龄特征已经没有空字段了。
寻找Embarked特征众数:
df_titanic['Embarked'].value_counts() # 寻找众数
实验结果:
S    644
C    168
Q     77
Name: Embarked, dtype: int64
实验证明,S为众数,我们用S将缺失值填充:
df_titanic['Embarked'] = df_titanic['Embarked'].fillna('S')  # 用众数填充缺失值
df_titanic.isnull().sum()    # 缺失值查询
实验结果:
PassengerId      0
Survived         0
Pclass           0
Name             0
Sex              0
Age              0
SibSp            0
Parch            0
Ticket           0
Fare             0
Cabin          687
Embarked         0
dtype: int64
Age和Embarked特征的缺失值已经被填充。同学可以试着用填充Embarked同样的方式去填充Cabin特征。
3.2 特征提取
将Sex特征和Embarked特征转换为哑特征,然后显示数据:
# 把类别型变量转换为哑变量
a = pd.get_dummies(df_titanic['Sex'], prefix = "Sex")
b = pd.get_dummies(df_titanic['Embarked'], prefix = "Em")
# 把哑变量添加进dataframe
frames = [df_titanic, a, b]
df_titanic = pd.concat(frames, axis = 1)
df_titanic = df_titanic.drop(columns = ['Sex', 'Embarked'])
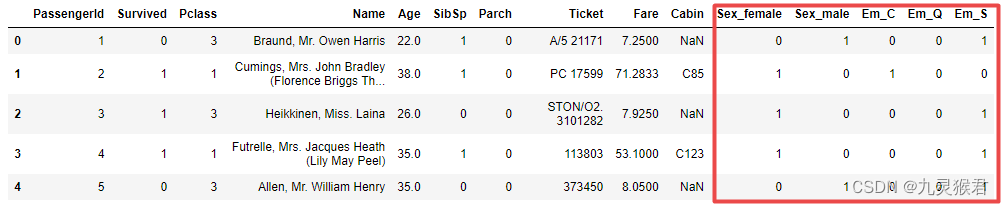
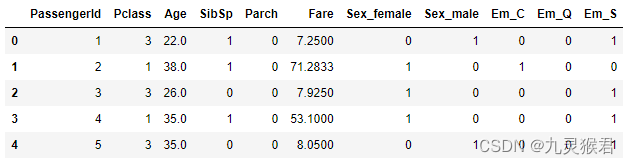
df_titanic.head() # 显示新的dataframe
实验结果:
3.3 特征选择
将不相关的特征从数据集中剔除:
X = df_titanic.drop(['Survived','Name','Ticket','Cabin'], axis=1) # 拿掉比较不相关的字段,构建特征集
y = df_titanic.Survived.values # 构建标签集
y = y.reshape(-1,1) # -1是相对索引,等价于len(y)
X.head()  # 显示特征数据的前五行
实验结果:
3.4 拆分数据集
将训练集数据拆分为训练集和测试集,按照8:2的比例拆分,80%的数据用来对模型进行训练,20%的数据用来对模型进行评估:
from sklearn.model_selection import train_test_split    # 导入拆分数据集的模块
X_train, X_test, y_train, y_test = train_test_split(X,y,test_size = 0.2)    # 将数据集拆分为8:2
print("X_train", X_train.shape)     # 显示训练集行列数
print("X_test", X_test.shape)       # 显示测试集行列数
实验结果:
X_train (712, 11)
X_test (179, 11)
接口说明:
X_train, X_test, y_train, y_test=sklearn.model_selection.train_test_split(train_data,
train_target,
test_size=0.4,
random_state=0,
stratify=y_train)
-
train_data:所要划分的样本特征集
-
train_target:所要划分的样本结果
-
test_size:样本占比,如果是整数的话就是样本的数量,默认为0.25
-
random_state:是随机数的种子。在需要重复试验的时候,保证得到一组一样的随机数。比如每次都填1,其他参数一样的情况下你得到的随机数组是一样的。但填0或不填,每次都会不一样。(参考代码)
-
返回值:X_train - 训练集特征集,X_test - 训练集标签,y_train - 测试集特征,y_test - 测试集标签
3.5 数据标准化
数据标准化是通过对原始数据进行变换把数据变换到均值为0,方差为1范围内。其数学表示如下:

mean为平均值,σ为标准差。由于标准化基于均值,所以受异常值影响较小。本实验我们采用sklearn.preprocessing中的StandardScaler,对数据进行标准化:
from sklearn.preprocessing import StandardScaler # 导入标准化模块

scaler = StandardScaler() # 选择标准化数据缩放器
X_train = scaler.fit_transform(X_train) # 特征标准化 训练集fit_transform
X_test = scaler.transform(X_test) # 特征标准化 测试集transform
4、模型构建
构建逻辑回归模型的接口为LogisticRegression(),包含在sklearn.linear_model模块中。创建完逻辑回归模型,可以直接使用fit()接口对模型进行训练。
4.1 构建模型
使用LogisticRegression()接口创建逻辑回归模型:
from sklearn.linear_model import LogisticRegression #导入逻辑回归模型

lr = LogisticRegression() # lr,就代表是逻辑回归模型
4.2 模型训练
使用fit()接口对模型进行训练,接口参数为训练集特征X_train和测试集标签y_train:
lr.fit(X_train,y_train) # fit,就相当于是梯度下降
5、模型评估
模型的评估采用从训练集中拆分出来的测试集来进行测试,用训练好的模型对测试集特征X_test进行预测,预测结果与测试集真实标签y_test进行比对,从而得出模型准确率。
5.1 模型评估
通过lr模型的score()接口对模型进行准确率的计算,接口参数为测试集特征X_test和测试集真实标签y_test。
score = lr.score(X_test,y_test)       # 计算准确率
print("SK-learn逻辑回归测试准确率 {:.2f}%".format(score*100))    # 打印结果
实验结果:
SK-learn逻辑回归测试准确率 77.09%
模型训练的准确率为77.09%。
5.2 数据预测
将test.csv中的数据导入,按照训练集数据预处理的方式对预测数据进行缺失值填充,标准化,然后通过训练好的模型进行预测。
读入预测数据
# 读入预测数据
df_titanic_test = pd.read_csv('../dataset/test.csv') # 读取文件
print("预测集数据:", df_titanic_test.shape)
df_titanic_test.head() # 显示前5行数据
实验结果:
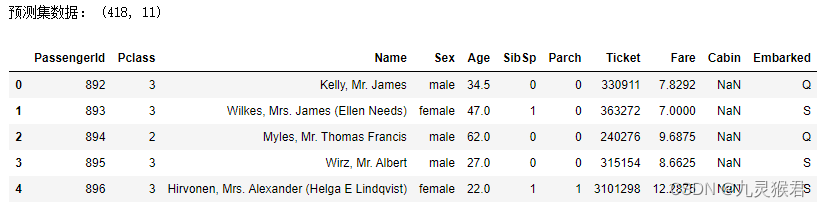
预测数据为11个特征,里面没有标签(是否生存)。
查询缺失值
# 缺失值查询

df_titanic_test.isnull().sum()
实验结果:
PassengerId      0
Pclass           0
Name             0
Sex              0
Age             86
SibSp            0
Parch            0
Ticket           0
Fare             1
Cabin          327
Embarked         0
dtype: int64
其中Age、Cabin和Fare有缺失值,我们仍然只对Age和Fare做填充,一般情况,Age和Fare用均值填充:
# 用均值填充Age和Fare
df_titanic_test['Age']=df_titanic_test['Age'].fillna(df_titanic_test['Age'].mean())
df_titanic_test['Fare']=df_titanic_test['Fare'].fillna(df_titanic_test['Fare'].mean())
df_titanic_test.isnull().sum()
实验结果:
PassengerId      0
Pclass           0
Name             0
Sex              0
Age              0
SibSp            0
Parch            0
Ticket           0
Fare             0
Cabin          327
Embarked         0
dtype: int64
填充完成。
将Sex和Embarked特征变为哑变量
# 把类别型变量转换为哑变量
a = pd.get_dummies(df_titanic_test['Sex'], prefix = "Sex")
b = pd.get_dummies(df_titanic_test['Embarked'], prefix = "Em")
# 把哑变量添加进dataframe
frames = [df_titanic_test, a, b]
df_titanic_test = pd.concat(frames, axis = 1)
df_titanic_test = df_titanic_test.drop(columns = ['Sex', 'Embarked'])
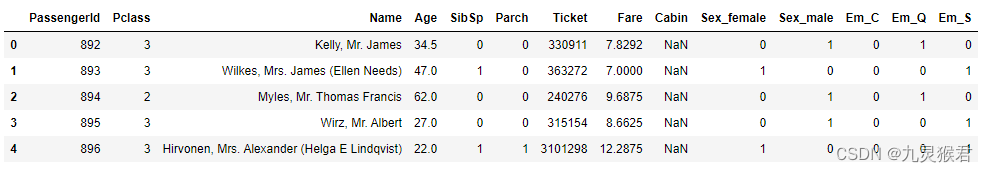
df_titanic_test.head() # 显示新的dataframe
实验结果:
剔除不相关特征
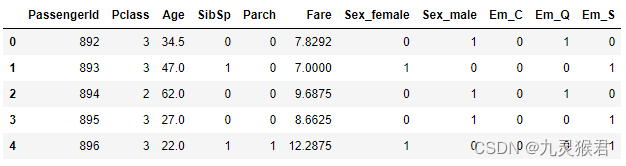
df_titanic_test = df_titanic_test.drop(['Name','Ticket','Cabin'], axis=1) # 拿掉比较不相关的字段,构建特征集
df_titanic_test.head()  # 显示特征数据的前五行
实验结果:
数据标准化
df_titanic_test = scaler.transform(df_titanic_test) # 特征标准化 测试集transform
数据预测
pred_titanic_test = lr.predict(df_titanic_test)  # 用lr模型对预测数据进行预测
print(pred_titanic_test)
实验结果:
[0 0 0 0 1 0 1 0 1 0 0 0 1 0 1 1 0 0 1 1 0 0 1 1 1 0 1 0 0 0 0 0 1 1 1 0 1
 1 0 0 0 1 0 1 1 0 1 0 1 1 1 0 1 1 0 0 0 0 0 1 0 0 0 1 1 1 1 0 1 1 1 0 1 1
 1 1 0 1 0 1 0 0 0 0 0 0 1 1 1 0 1 0 1 0 1 0 1 0 1 0 1 0 0 0 1 0 0 0 0 0 0
 1 1 1 1 0 0 1 1 1 1 0 1 0 0 1 0 1 0 0 0 0 1 0 0 0 0 0 1 0 0 1 0 0 0 0 1 0
 1 0 1 0 0 1 0 0 1 1 0 1 1 0 1 0 0 1 0 0 1 1 0 0 0 0 0 1 1 0 1 1 0 1 1 0 1
 0 1 0 0 0 0 1 0 0 0 0 1 1 0 1 1 0 1 1 0 1 1 0 1 0 0 0 0 1 0 0 1 0 1 0 1 0
 1 0 1 1 0 1 0 0 0 1 0 0 1 0 0 0 1 1 1 1 0 0 0 0 1 0 1 1 1 0 1 0 0 0 0 0 1
 0 0 0 1 1 0 0 1 0 1 0 1 0 1 1 0 1 0 0 0 0 1 0 1 1 1 0 0 1 0 0 1 1 0 0 0 0
 1 0 1 0 0 0 0 0 1 1 0 0 0 0 0 0 0 1 1 1 0 0 0 0 0 0 0 1 1 0 1 1 0 0 1 1 0
 1 0 1 0 0 0 0 0 0 0 1 0 1 0 1 0 1 1 0 0 0 1 0 1 0 0 1 0 1 1 0 1 0 0 1 1 0
 0 1 0 0 1 1 1 0 0 0 0 0 1 1 0 1 0 0 0 0 1 1 0 0 0 1 0 1 0 0 1 0 1 1 0 0 0
 0 1 1 1 1 1 0 1 0 0 0]
计算生存率
survival_rate = pred_titanic_test.tolist().count(1)/len(pred_titanic_test.tolist())  # tolist()是将ndarray类型转换为list类型
print("泰坦尼克号乘客生存率为: {:.2f}%".format(survival_rate*100))    # 打印结果
实验结果:
泰坦尼克号乘客生存率为: 36.12%


 4861
4861


 被折叠的 条评论
为什么被折叠?
被折叠的 条评论
为什么被折叠?
 到【灌水乐园】发言


