


使用三次贝塞尔曲线平滑svg路径
和一点三角函数
该文章来自于 smooth-a-svg-path-with-cubic-bezier-curves
虽然在 Svg 元素中绘制直线很简单,但需要一些三角学来平滑这些线。让我们看看如何。

我们有一个数组,表示一条线的点坐标。
const points = [[5, 10], [10, 40], [40, 30], [60, 5], [90, 45], [120, 10], [150, 45], [200, 10]]
HTML 页面中的 Svg 元素:
<svg viewBox="0 0 200 200" version="1.1" xmlns="http://www.w3.org/2000/svg" class="svg"></svg>
我们想从点数组中创建一个 <path> 元素。
创建path由这个点
<path> 的 d 属性始终以移动到命令:M x,y 开头,后面跟着几个命令,具体取决于形状的类型。结果类似于: <path d="M 10,20 L 15,25 L 20,35"> 表示直线。
首先,让我们创建一个通用的 svgPath 函数,它有两个参数:point数组和command函数。
// Render the svg <path> element
// I:  - points (array): points coordinates
//     - command (function)
//       I:  - point (array) [x,y]: current point coordinates
//           - i (integer): index of 'point' in the array 'a'
//           - a (array): complete array of points coordinates
//       O:  - (string) a svg path command
// O:  - (string): a Svg <path> element
const svgPath = (points, command) => {
  // build the d attributes by looping over the points
  const d = points.reduce((acc, point, i, a) => i === 0
    // if first point
    ? `M ${point[0]},${point[1]}`
    // else
    : `${acc} ${command(point, i, a)}`
  , '')
  return `<path d="${d}" fill="none" stroke="grey" />`
}
现在,让我们创建两个命令函数:
lineCommand: 画直线.lineCommand: 画平滑的线.
画直线
直线需要指令line to,以字母 L 开头,后跟终点 x、y 的坐标。
绘制直线的基本 lineCommand 函数:
// Svg path line command
// I:  - point (array) [x, y]: coordinates
// O:  - (string) 'L x,y': svg line command
const lineCommand = point => `L ${point[0]} ${point[1]}`
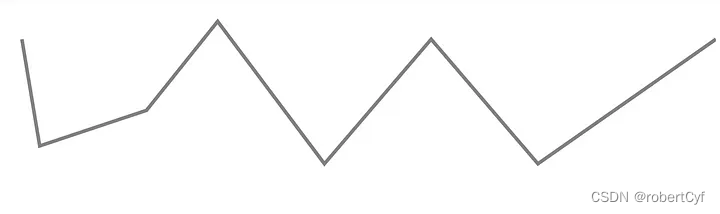
现在我们可以用它从点数组中画一条线:
const svg = document.querySelector('.svg')
svg.innerHTML = svgPath(points, lineCommand)
这给出了以下结果
画平滑的曲线
三次贝塞尔曲线命令
三次贝塞尔曲线命令以字母 C 开头,后跟三对坐标x1,y1 x2,y2 x,y:
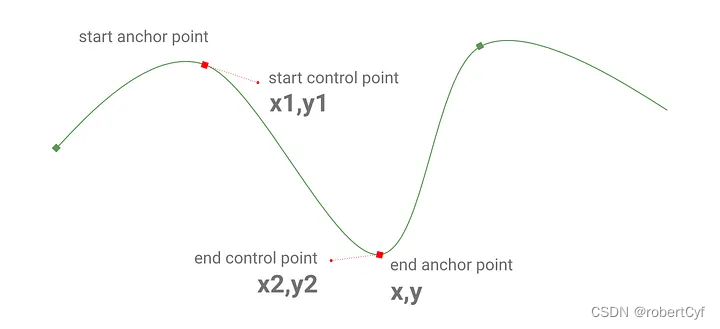
x1,y1: 起始控制点坐标x2,y2: 终点控制点坐标x,y: 结束锚点的坐标
需要注意:
- 起始锚点坐标由上一个命令给出。
- 结束锚点坐标来自原始点数组。
- 现在我们必须找到两个控制点的位置。
找到控制点的位置
我们用一条线将起始锚点和结束锚点周围的锚点连接起来(我们将其称为对立线):
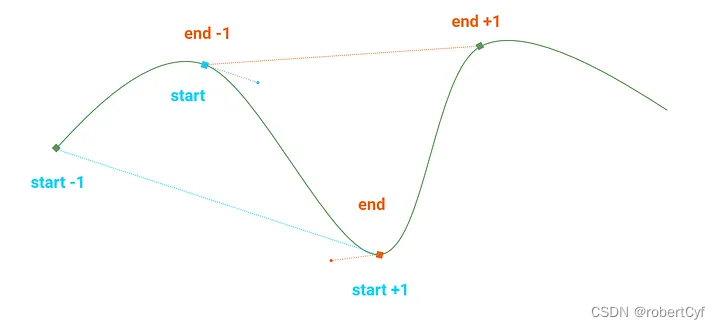
为了使线条平滑,每个控制点的位置必须相对于其对立线:
- 控制点位于与
对立线平行且与当前锚点相切的线上。 - 在该切线上,从锚点到控制点的距离取决于
对立线的长度和任意平滑比。 - 起始控制点与
对立线的方向相同,而结束控制点则向后。
code
首先,找到对立线的属性的函数:
// Properties of a line
// I:  - pointA (array) [x,y]: coordinates
//     - pointB (array) [x,y]: coordinates
// O:  - (object) { length: l, angle: a }: properties of the line
const line = (pointA, pointB) => {
  const lengthX = pointB[0] - pointA[0]
  const lengthY = pointB[1] - pointA[1]
  return {
    length: Math.sqrt(Math.pow(lengthX, 2) + Math.pow(lengthY, 2)),
    angle: Math.atan2(lengthY, lengthX)
  }
}
然后,找到控制点位置的函数:
// Position of a control point
// I:  - current (array) [x, y]: current point coordinates
//     - previous (array) [x, y]: previous point coordinates
//     - next (array) [x, y]: next point coordinates
//     - reverse (boolean, optional): sets the direction
// O:  - (array) [x,y]: a tuple of coordinates
const controlPoint = (current, previous, next, reverse) => {
  // When 'current' is the first or last point of the array
  // 'previous' or 'next' don't exist.
  // Replace with 'current'
  const p = previous || current
  const n = next || current
  // The smoothing ratio
  const smoothing = 0.2
  // Properties of the opposed-line
  const o = line(p, n)
  // If is end-control-point, add PI to the angle to go backward
  const angle = o.angle + (reverse ? Math.PI : 0)
  const length = o.length * smoothing
  // The control point position is relative to the current point
  const x = current[0] + Math.cos(angle) * length
  const y = current[1] + Math.sin(angle) * length
  return [x, y]
}
创建贝塞尔曲线的函数C命令:
// Create the bezier curve command
// I:  - point (array) [x,y]: current point coordinates
//     - i (integer): index of 'point' in the array 'a'
//     - a (array): complete array of points coordinates
// O:  - (string) 'C x2,y2 x1,y1 x,y': SVG cubic bezier C command
const bezierCommand = (point, i, a) => {
  // start control point
  const [cpsX, cpsY] = controlPoint(a[i - 1], a[i - 2], point)
  // end control point
  const [cpeX, cpeY] = controlPoint(point, a[i - 1], a[i + 1], true)
  return `C ${cpsX},${cpsY} ${cpeX},${cpeY} ${point[0]},${point[1]}`
}
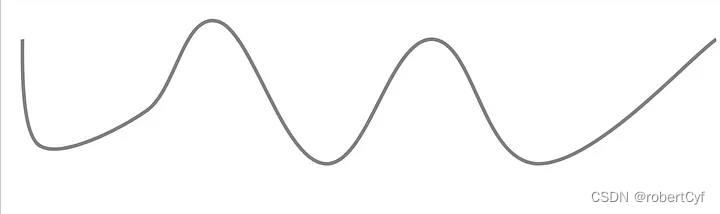
最后,我们重用 svgPath 函数来循环数组的点并构建 <path> 元素。然后我们将 <path> 附加到 <svg> 元素。
const svg = document.querySelector('.svg')
svg.innerHTML = svgPath(points, bezierCommand)


 3822
3822

 被折叠的 条评论
为什么被折叠?
被折叠的 条评论
为什么被折叠?
 到【灌水乐园】发言


