


 本文介绍如何使用SVG绘制平滑的贝塞尔曲线,并提供了一个具体的实现方法。通过计算控制点的位置来确保曲线不会超出预设范围。
需求目标
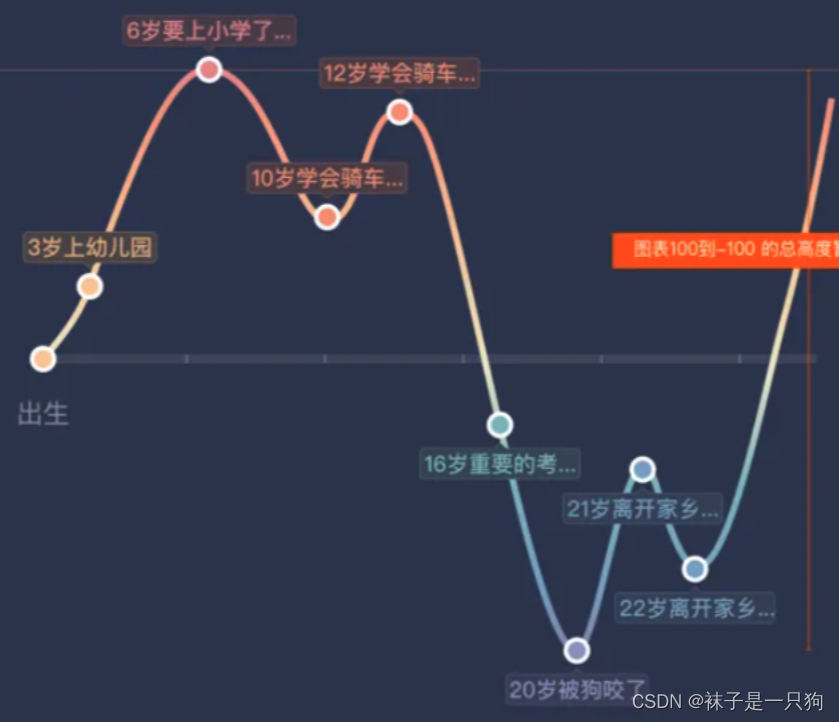
一、首先要了解贝塞尔曲线
二、实例曲线方法代码
      const getDistance = (p1, p2) => {
        return Math.sqrt(
          Math.pow(p1.x + p2.x, 2)
              +
              Math.pow(p1.y + p1.y, 2)
        );
      };
      const getControlpoint = (point, point1, point2) => {//三个点出两个控制点
        const p01 = getDistance(point, point1);
        const p12 = getDistance(point1, point2);
        const p02 = p01 + p12;
        let vector = [point2.x - point.x, point2.y - point.y];
        let x1 = Math.round(point1.x - vector[0] * 0.3 * p01 / p02);
        let y1 = Math.round(point1.y - vector[1] * 0.3 * p01 / p02);

        // 调整  把控制点放在俩个点的矩形内
        if (x1 < point.x) {
          x1 = point.x;
        }
        if (x1 > point1.x) {
          x1 = point1.x;
        }

        if (point.y < point1.y) {
          if (y1 < point.y) {
            y1 = point.y;
          }
          if (y1 > point1.y) {
            y1 = point1.y;
          }
        } else {
          if (y1 < point1.y) {
            y1 = point1.y;
          }
          if (y1 > point.y) {
            y1 = point.y;
          }
        }


        let x2 = Math.round(point1.x + vector[0] * 0.5 * p01 / p02);
        let y2 = Math.round(point1.y + vector[1] * 0.5 * p01 / p02);

        if (x2 < point1.x) {
          x2 = point1.x;
        }
        if (x2 > point2.x) {
          x2 = point2.x;
        }

        if (point1.y < point2.y) {
          if (y2 < point1.y) {
            y2 = point1.y;
          }
          if (y2 > point2.y) {
            y2 = point2.y;
          }
        } else {
          if (y2 < point2.y) {
            y2 = point2.y;
          }
          if (y2 > point1.y) {
            y2 = point1.y;
          }
        }

        return [
          {
            x: x1,
            y: y1
          },
          {
            x: x2,
            y: y2
          }
        ];
      };

      let drawLine = (data, paper)=>{
        var path = [], len = data.length;
        let a = [];
        ///获取控制点
        // 只有俩个点的时候 第三个点虚拟一个创造控制点
        let i = 1
        if (len == 2) {
          let next  = {
            ...data[i]
          };
          next.x = next.x + 5;
          next.y = 0;
          if (data[i + 1]) {
            next =  data[i + 1];
          }
          a = a.concat(getControlpoint(data[i - 1], data[i], next));
        }
        for (; i < len - 1; i++) {
          a = a.concat(getControlpoint(data[i - 1], data[i], data[i + 1]));
        }
        path[1] = paper.path('M' + data[0].x + ',' + data[0].y + 'Q' + a[0].x + ',' + a[0].y + ',' + data[1].x + ',' + data[1].y);
        ///从二开始画曲线
        for (let i = 2; i < len - 1; i++) {
          var point = data[i];
          var x = point.x;
          var y = point.y;
          path[i] = paper.path('M' + data[i - 1].x + ',' + data[i - 1].y + 'C' + a[(i - 2) * 2 + 1].x + ',' + a[(i - 2) * 2 + 1].y + ',' + a[(i - 1) * 2].x + ',' + a[(i - 1) * 2].y + ',' + x + ',' + y);
        }
        //console.log(a,i)


        if (i > 1) {
          ///最后画贝塞尔曲线
          path[i] = paper.path('M' + data[i - 1].x + ',' + data[i - 1].y + 'Q' + a[(i - 2) * 2 + 1].x + ',' + a[(i - 2) * 2 + 1].y + ',' + data[i].x + ',' + data[i].y);
        }


        for (let index = 1; index < (path.length==1?2:path.length); index++) {
          const element = path[index];
          element.fill('none');

          // 获取到当前路线原来的俩个数值 中间的数值

          let y1 = pointList[index - 1].impactValue;
          let y2 = pointList[index].impactValue;
          let yList = [];
          if (y1 < y2) {
            for (let i = y2;i >= y1;i -= 10) {
              yList.push(i);
            }
          } else {
            for (let i = y1;i >= y2;i -= 10) {
              yList.push(i);
            }
          }
          // 计算出这俩个点之间需要的渐变
          let linear = paper.gradient('linear', function (add) {
            yList.forEach((e, _index) => {
              let value = colorMap[e];
              // console.log((1/(yList.length-1)*_index).toFixed(2), value, yList.length);
              add.stop(Number((1 / (yList.length - 1) * _index).toFixed(2)), value);
            });
          }).from(0,0).to(0,1);
          if (yList.length == 1) {
            linear = colorMap[yList[0]];
          }
          element.addClass('all-drawline-group');
          element.stroke({ color:linear,
            width: 4,
            linecap: 'round',
            linejoin: 'round',
            dasharray: `${element.length()}`,
            dashoffset:`${element.length()}` });
          element.timeline(this.timeline);
          element.animate(250, index * 250 + 1500, 'absolute').attr({ 'stroke-dashoffset': 0 });
        }

      };

/*  其中 parper 为 parper = SVG() svg画布对象
    pointList 为每个点的坐标 [{x: 1, y: 1}]
    // 渐变和动画 可以去掉 这里可以参考 svg.js 的渐变 和 动画 timeline 不做详细介绍
*/
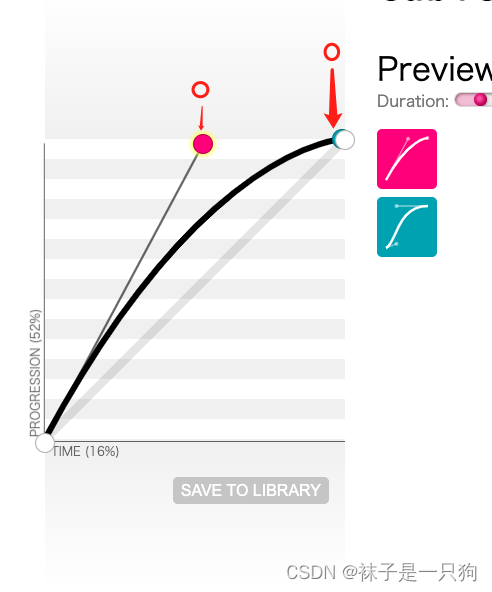
三、曲线优化
为了保证曲线不超出范围,像下面这样
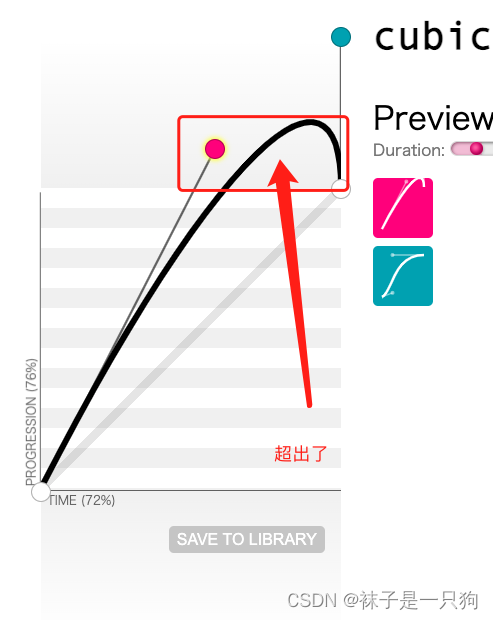
需要保证俩个点都在矩形范围内,上面代码 获取控制点的方法中 getControlpoint // 调整 把控制点放在俩个点的矩形内 就是为了处理这个


 2022
2022

 被折叠的 条评论
为什么被折叠?
被折叠的 条评论
为什么被折叠?
 到【灌水乐园】发言


