


阅读前请看一下:我是一个热衷于记录的人,每次写博客会反复研读,尽量不断提升博客质量。文章设置为仅粉丝可见,是因为写博客确实花了不少精力。希望互相进步谢谢!!
文章目录
1、问题描述:
提示:这里简述项目相关背景:
机器学习时python matplotlib画图显示不出来
train_x = np.array([50, 51, 52, 53, 54, 55, 56, 57, 58, 59, 61, 62, 63, 64, 65, 66, 67, 68, 69, 70]).reshape((1, -1))
train_y = np.array([0, 0, 0, 0, 0, 0, 0, 0, 0, 0, 1, 1, 1, 1, 1, 1, 1, 1, 1, 1]).reshape((1, -1))
plt.figure()
plt.plot(train_x,train_y)
plt.xlabel("Iteration")
plt.ylabel("Costs")
plt.show()
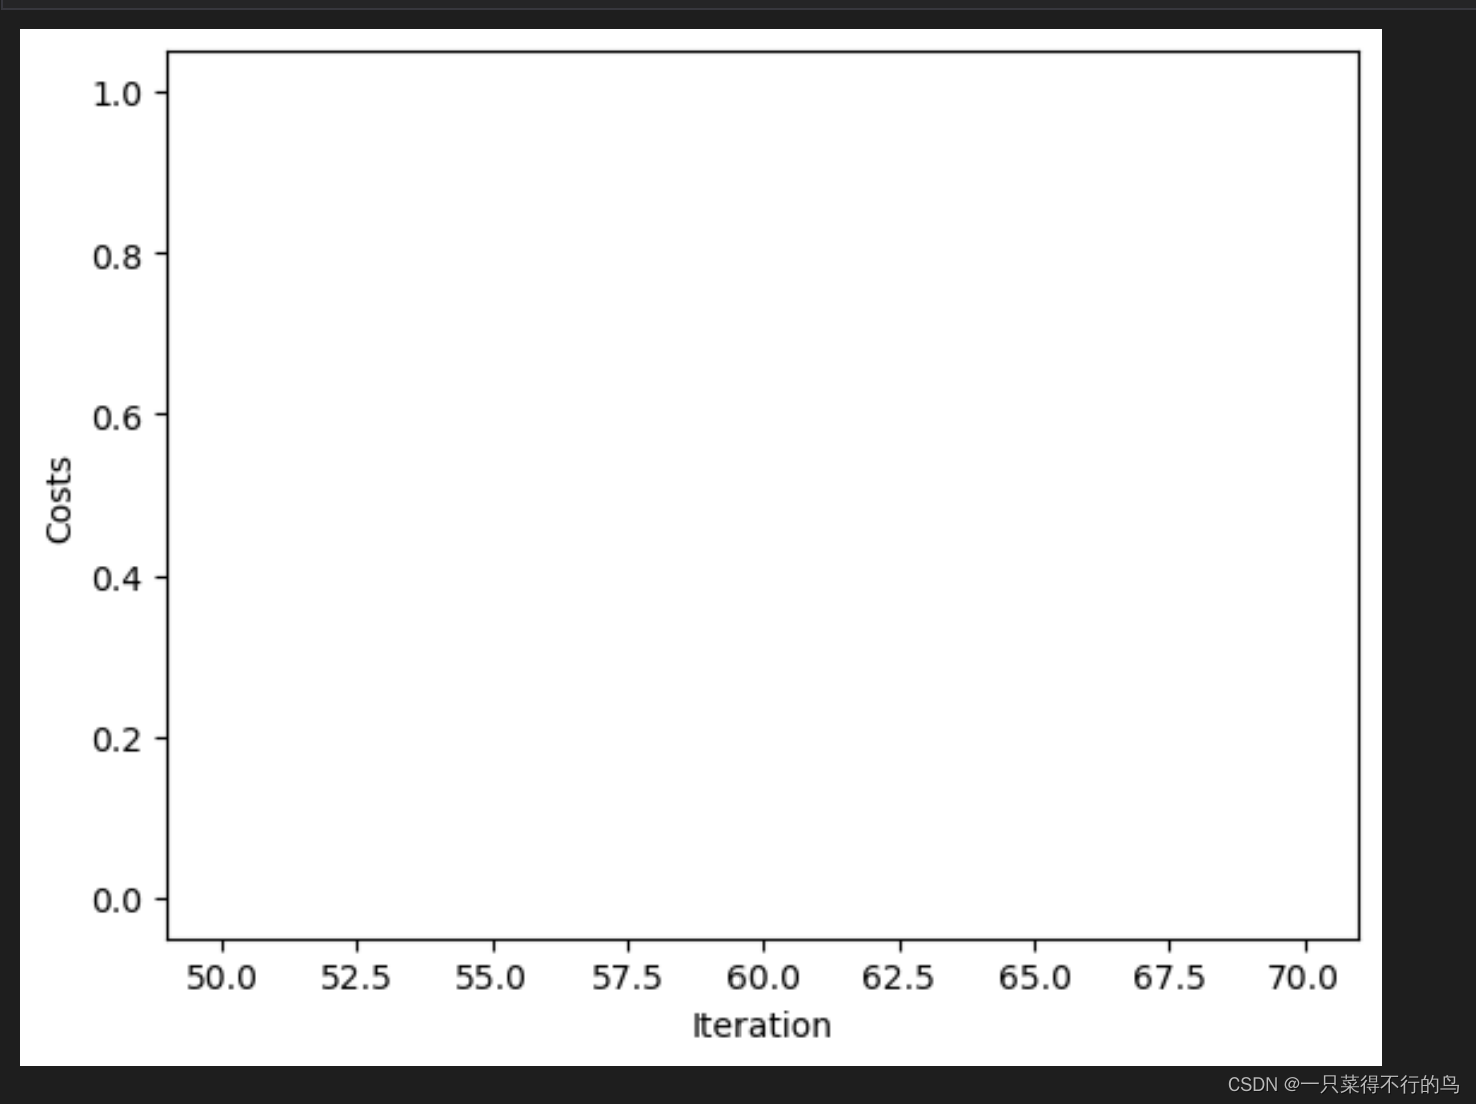
看到上面啥也没有
2、原因分析:
train_x和train_y这里都是二维,shape为(1,20)
plot( )参数要求传入的是数组(一维)
关于plot()函数的参数和用法看下面两篇文章:
plt.plot()函数参数(最清晰的解释)
plt.plot()函数的具体用法
3、解决方案:
将train_x和train_y转化为 一维!!!
方法一,squeeze()函数
语法:numpy.squeeze(a,axis = None)
作用:从数组的形状中删除单维度条目,即把shape中为1的维度去掉
场景:在机器学习和深度学习中,通常算法的结果是可以表示向量的数组(即包含两对或以上的方括号形式[[]]),如果直接利用这个数组进行画图可能显示界面为空(见后面的示例)。我们可以利用squeeze()函数将表示向量的数组转换为秩为1的数组,这样利用matplotlib库函数画图时,就可以正常的显示结果了。
import numpy as np
import matplotlib.pyplot as plt
train_x = np.array([50, 51, 52, 53, 54, 55, 56, 57, 58, 59, 61, 62, 63, 64, 65, 66, 67, 68, 69, 70]).reshape((1, -1))
train_y = np.array([0, 0, 0, 0, 0, 0, 0, 0, 0, 0, 1, 1, 1, 1, 1, 1, 1, 1, 1, 1]).reshape((1, -1))
plt.figure()
plt.plot(np.squeeze(train_x), np.squeeze(train_y))   #squeeze()函数删除单维度条目
plt.xlabel("Iteration")
plt.ylabel("Costs")
plt.show()
关于np.squeeze看下面这篇文章:
方法二,.reshape(-1)
.reshape(-1)转化为一维的行向量
import numpy as np
import matplotlib.pyplot as plt
train_x = np.array([50, 51, 52, 53, 54, 55, 56, 57, 58, 59, 61, 62, 63, 64, 65, 66, 67, 68, 69, 70]).reshape((1, -1))
train_y = np.array([0, 0, 0, 0, 0, 0, 0, 0, 0, 0, 1, 1, 1, 1, 1, 1, 1, 1, 1, 1]).reshape((1, -1))
plt.figure()
plt.plot(train_x.reshape(-1), train_y.reshape(-1))
plt.xlabel("Iteration")
plt.ylabel("Costs")
plt.show()
关于.reshape(-1) 、.reshape(-1,1)、 .reshape(1,-1)看我之前写的文章
python numpy中的reshape(-1)、reshape(1,-1)、reshape(-1,1)
方法三,flatten()函数
import numpy as np
import matplotlib.pyplot as plt
train_x = np.array([50, 51, 52, 53, 54, 55, 56, 57, 58, 59, 61, 62, 63, 64, 65, 66, 67, 68, 69, 70]).reshape((1, -1))
train_y = np.array([0, 0, 0, 0, 0, 0, 0, 0, 0, 0, 1, 1, 1, 1, 1, 1, 1, 1, 1, 1]).reshape((1, -1))
plt.figure()
plt.plot(train_x.flatten(), train_y.flatten())
plt.xlabel("Iteration")
plt.ylabel("Costs")
plt.show()
方法四,ravel()函数
import numpy as np
import matplotlib.pyplot as plt
train_x = np.array([50, 51, 52, 53, 54, 55, 56, 57, 58, 59, 61, 62, 63, 64, 65, 66, 67, 68, 69, 70]).reshape((1, -1))
train_y = np.array([0, 0, 0, 0, 0, 0, 0, 0, 0, 0, 1, 1, 1, 1, 1, 1, 1, 1, 1, 1]).reshape((1, -1))
plt.figure()
plt.plot(train_x.ravel(), train_y.ravel())
plt.xlabel("Iteration")
plt.ylabel("Costs")
plt.show()
4、结论
画图时x,y一定要转化为一维,不然二维没法显示线,最多显示点!!!
掌握四种二维转一维的方法。
码字不易,谢谢点赞!!!
码字不易,谢谢点赞!!!
码字不易,谢谢点赞!!!


 2096
2096

 被折叠的 条评论
为什么被折叠?
被折叠的 条评论
为什么被折叠?
 到【灌水乐园】发言


