


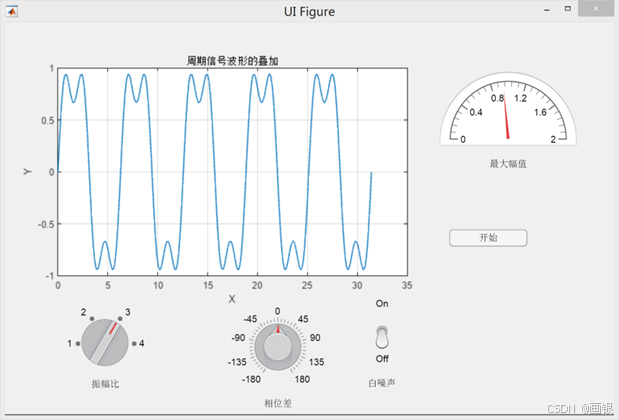
应用App Designer生成一个用于观察周期信号波形叠加效果的程序模块。该应用程序可以观察不同振幅比、相位差的基波和3次谐波的叠加波形,此外还可以在信号中加入白噪声。右边的仪表显示波形的最大振幅。如图所示
教程如下:

先新建一个上图这样的界面 把组件都搬好 左下是离散旋钮 中下是旋钮 右下是开关(切换) 开始是状态按钮 ,不要拿错了,不要拿错了,不要拿错了

注意右上角的命名 不用在意名字顺序 注意组件和名字对应
%把左下旋钮命名为ARadio
%把中间旋钮命名为PhDiff
%右下开关的名字为Noise
%WaveA为右上半圆盘的名字
%UIAxes为左上坐标轴的名字

右键 图中的开始按钮选择 回调 ,点击转至 ButtonValueChanged回调(看清楚函数名 如果不一样说明按钮拿错了 回上文再看看)

会进入这样的界面,然后复制下面代码进去
			value = app.Button.Value;
            %复制到开始按钮的回调函数
            amr=eval(app.ARadio.Value);
            %把左下旋钮命名为ARadio
            theta=app.PhDiff.Value/180*pi;
            %把中间旋钮命名为PhDiff
            x=linspace(0,10*pi,300);
            y=sin(x)+sin(3*x+theta)/amr;
            if strcmp(app.Noise.Value,'On')
                %右下开关的名字为Noise
                 y=awgn(y,30);
            end
            app.WaveA.Value=max(y);
            %WaveA为右上半圆盘的名字
            plot(app.UIAxes,x,y,'LineWidth',0.1);
            %UIAxes为左上坐标轴的名字
如果运行成功 就代表已经成功了
如果运行报错 请检查第一张仪表图的范围比例是否正确 如振幅比是1到4 相位差是-180到180等等
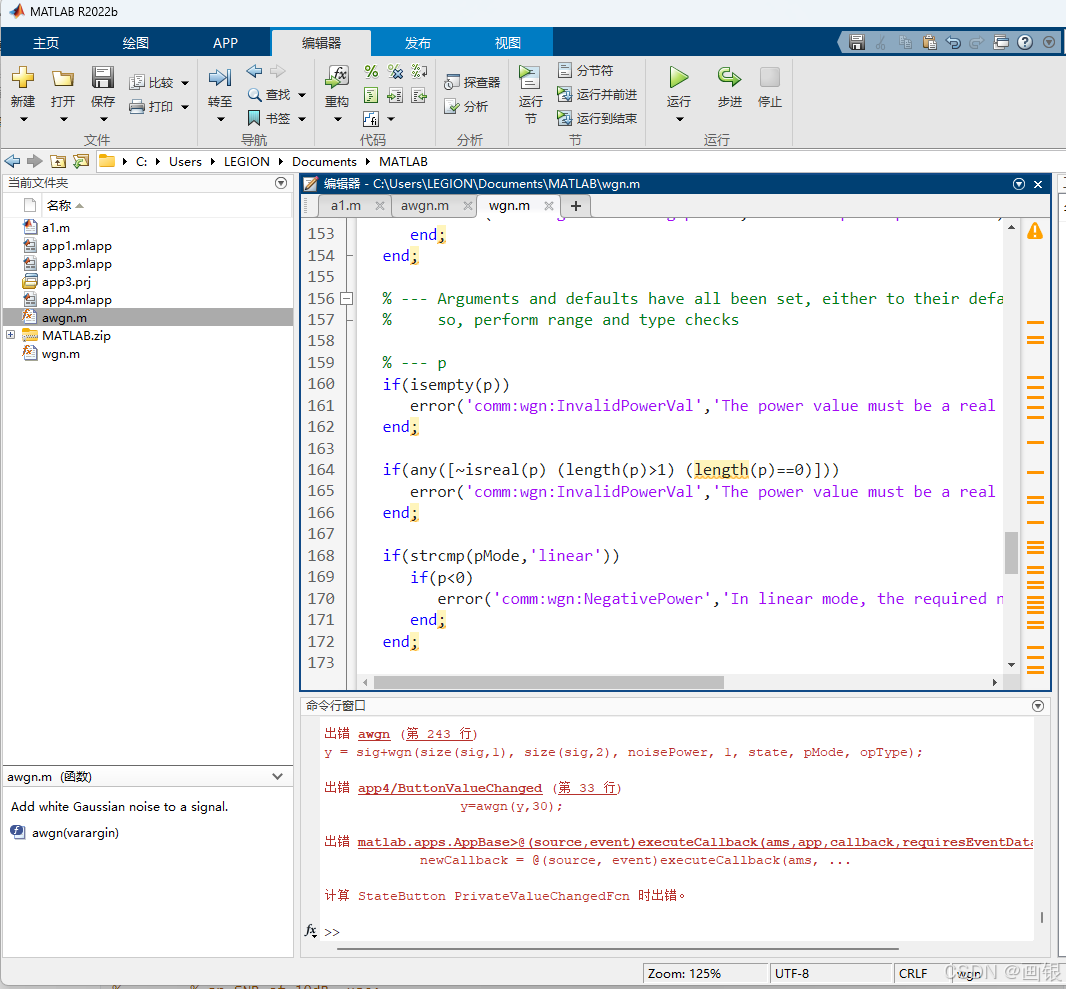
如果在y=awgn(y,30);这里报错,是因为缺少awgn和wgn函数,此时回到matlab主界面中(不是appdesigner),在左边的文件区(注意当前文件夹一定要和存放该appdesigner文件的文件夹一致)新建两个文件 命名为awgn.m和wgn.m 然后打开后分别把下面代码填入
awgn.m
function y=awgn(varargin)
%AWGN Add white Gaussian noise to a signal.
%   Y = AWGN(X,SNR) adds white Gaussian noise to X.  The SNR is in dB.
%   The power of X is assumed to be 0 dBW.  If X is complex, then
%   AWGN adds complex noise.
%
%   Y = AWGN(X,SNR,SIGPOWER) when SIGPOWER is numeric, it represents
%   the signal power in dBW. When SIGPOWER is 'measured', AWGN measures
%   the signal power before adding noise.
%
%   Y = AWGN(X,SNR,SIGPOWER,STATE) resets the state of RANDN to STATE.
%
%   Y = AWGN(..., POWERTYPE) specifies the units of SNR and SIGPOWER.
%   POWERTYPE can be 'db' or 'linear'.  If POWERTYPE is 'db', then SNR
%   is measured in dB and SIGPOWER is measured in dBW.  If POWERTYPE is
%   'linear', then SNR is measured as a ratio and SIGPOWER is measured
%   in Watts.
%
%   Example 1:
%        % To specify the power of X to be 0 dBW and add noise to produce
%        % an SNR of 10dB, use:
%        X = sqrt(2)*sin(0:pi/8:6*pi);
%        Y = awgn(X,10,0);
%
%   Example 2:
%        % To specify the power of X to be 3 Watts and add noise to
%        % produce a linear SNR of 4, use:
%        X = sqrt(2)*sin(0:pi/8:6*pi);
%        Y = awgn(X,4,3,'linear');
%
%   Example 3:
%        % To cause AWGN to measure the power of X and add noise to
%        % produce a linear SNR of 4, use:
%        X = sqrt(2)*sin(0:pi/8:6*pi);
%        Y = awgn(X,4,'measured','linear');
%
%   See also WGN, RANDN, and BSC.

%   Copyright 1996-2008 The MathWorks, Inc.
%   $Revision: 1.9.4.6 $  $Date: 2008/08/22 20:23:43 $

% --- Initial checks
error(nargchk(2,5,nargin,'struct'));

% --- Value set indicators (used for the string flags)
pModeSet    = 0;
measModeSet = 0;

% --- Set default values
sigPower = 0;
pMode    = 'db';
measMode = 'specify';
state    = [];

% --- Placeholder for the signature string
sigStr = '';

% --- Identify string and numeric arguments
for n=1:nargin
   if(n>1)
      sigStr(size(sigStr,2)+1) = '/';
   end
   % --- Assign the string and numeric flags
   if(ischar(varargin{
   n}))
      sigStr(size(sigStr,2)+1) = 's';
   elseif(isnumeric(varargin{
   n}))
      sigStr(size(sigStr,2)+1) = 'n';
   else
      error('comm:awgn:InvalidArg','Only string and numeric arguments are allowed.');
   end
end

% --- Identify parameter signatures and assign values to variables
switch sigStr
   % --- awgn(x, snr)
   case 'n/n'
      sig      = varargin{
   1};
      reqSNR   = varargin{
   2};

   % --- awgn(x, snr, sigPower)
   case 'n/n/n'
      sig      = varargin{
   1};
      reqSNR   = varargin{
   2};
      sigPower = varargin{
   3};

   % --- awgn(x, snr, 'measured')
   case 'n/n/s'
      sig      = varargin{
   1};
      reqSNR   = varargin{
   2};
      measMode = lower(varargin{
   3});

      measModeSet = 1;

   % --- awgn(x, snr, sigPower, state)
   case 'n/n/n/n'
      sig
最低0.47元/天 解锁文章


 681
681

 被折叠的 条评论
为什么被折叠?
被折叠的 条评论
为什么被折叠?
 到【灌水乐园】发言


