


首先声明,这个图是从这个哥们这里弄来的。自己再加以修改的。以更加贴合我自己的代码需求
 https://blog.csdn.net/zyg1515330502/article/details/81908983
var myChart = echarts.init(document.getElementById('main'));
// 指定图表的配置项和数据
var categoryData = []; //X轴数据
var errorData = []; //错误的数据
var barData = []; // 柱状图数据
var dataCount = 2; //数据数量
for(var i = 0; i < dataCount; i++) {
var val = Math.random() * 1000; //random() 方法可返回介于 0 ~ 1 之间的一个随机数。
categoryData.push(i);
errorData.push([
i,
echarts.number.round(Math.max(0, val - Math.random() * 100)), //max() 方法可返回两个指定的数中带有较大的值的那个数。
echarts.number.round(val + Math.random() * 80)
]);
barData.push(echarts.number.round(val, 2));
}
console.log(echarts.number.round);
console.log(errorData);
console.log(barData);
/*
params:包含了当前数据信息和坐标系的信息。
api:是一些开发者可调用的方法集合。
api.value(...),意思是取出 dataItem 中的数值。例如 api.value(0) 表示取出当前 dataItem 中第一个维度的数值。
api.coord(...),意思是进行坐标转换计算。例如 var point = api.coord([api.value(0), api.value(1)]) 表示 dataItem 中的数值转换成坐标系上的点。
api.size(...) 函数,表示得到坐标系上一段数值范围对应的长度。
shape 属性描述了这个矩形的像素位置和大小。
*/
function renderItem(params, api) {
var xValue = api.value(0); //api.value(0) 表示取出当前 dataItem 中第一个维度的数值。
var highPoint = api.coord([xValue, api.value(1)]); //高点
var lowPoint = api.coord([xValue, api.value(2)]); //低点
// var halfWidth = api.size([1, 0])[0] * 0.1; //半宽度
var halfWidth = 10;
var style = api.style({
stroke: api.visual('color'),
fill: null
});
return {
type: 'group',
children: [
{
type: 'line',
shape: {
x1: highPoint[0] - halfWidth,
y1: highPoint[1],
x2: highPoint[0] + halfWidth,
y2: highPoint[1]
},
style: style
},
{
type: 'line',
shape: {
x1: highPoint[0],
y1: highPoint[1],
x2: lowPoint[0],
y2: lowPoint[1]
},
style: style
},
{
type: 'line',
shape: {
x1: lowPoint[0] - halfWidth,
y1: lowPoint[1],
x2: lowPoint[0] + halfWidth,
y2: lowPoint[1]
},
style: style
}
]
};
}
option = {
tooltip: {
trigger: 'axis',
axisPointer: {
type: 'shadow'
}
},
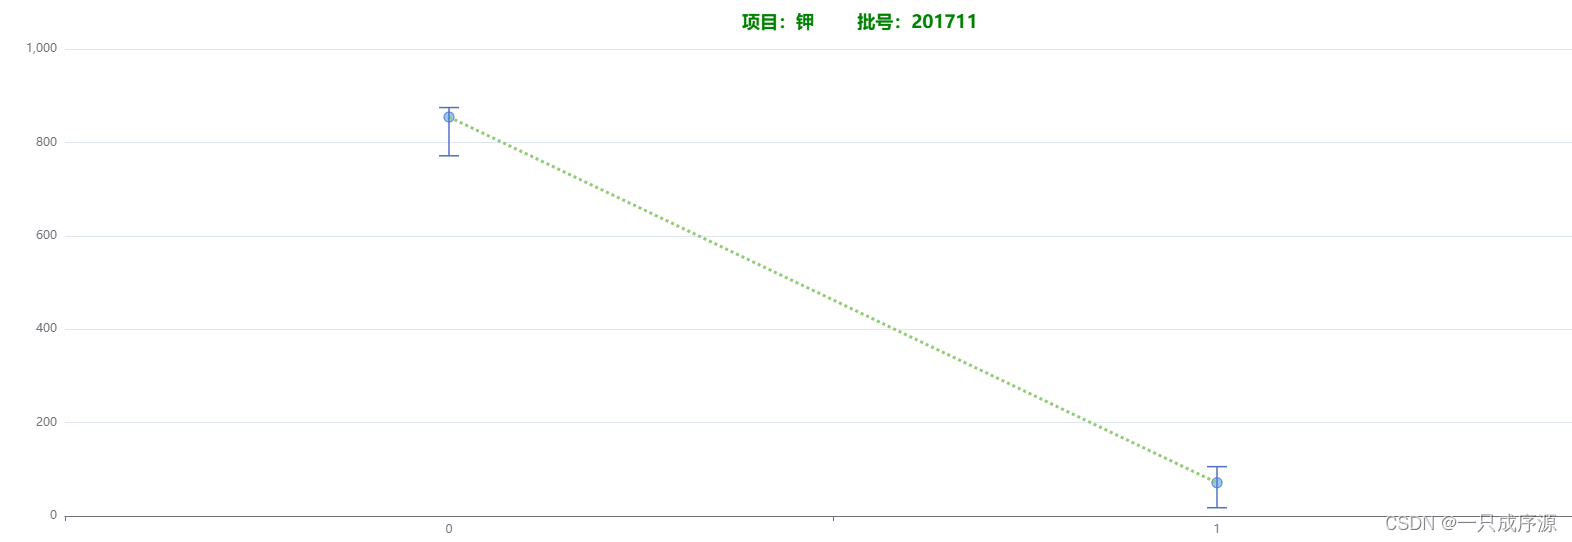
title: [
{
text: '项目:钾',
left: '45%',
top: 20,
textStyle: {
color: 'green',
//fontSize: '14',
},
},
{
text: '批号:201711',
left: '51%',
top: 20,
textStyle: {
color: 'green',
//fontSize: '14',
},
},
{
text: '仪器',
//borderColor: '#999',
//borderWidth: 1,
textStyle: {
fontSize: 14
},
left: 'center',
top: '94%'
},
],
// legend: {
// data: ['bar', 'error']
// },
/*dataZoom: [
{
type: 'slider',
start: 50,
end: 70
},
{
type: 'inside',
start: 50,
end: 70
}
],*/
xAxis: {
data: categoryData,
},
yAxis: {},
series: [
{
type: 'scatter',
name: 'scatter',
data: barData,
itemStyle: {
normal: {
color: '#77bef7',
borderColor:"#5470C6"
}
}
},
{
type: 'custom',
name: 'error',
itemStyle: {
normal: {
borderWidth: 1.5
}
},
renderItem: renderItem,
encode: { //可以定义 data 的哪个维度被编码成什么
x: 0,// data 中『维度0』对应到 X 轴
y: [1, 2] // data 中『维度1』和『维度2』对应到 Y轴
},
data: errorData,
z: 100
},
{
name: 'MA30',
type: 'line',
data: barData,
showSymbol: false,
lineStyle: {
width: 3,
type:'dotted'
}
}
]
};
// 使用刚指定的配置项和数据显示图表。
myChart.setOption(option);


 2480
2480

 被折叠的 条评论
为什么被折叠?
被折叠的 条评论
为什么被折叠?
 到【灌水乐园】发言


