


backtrace定位程序崩溃问题
最近发现一版程序频繁出现段错误导致程序种某进程重启的情况,由于进程线程资源较多无法通过插装的方式一一排查,且debug信息不足以支撑问题定位,所以尝试使用backtrace进行问题溯源。
Linux man手册中对backtrace的描述如下:
  BACKTRACE(3)                                                              Linux Programmer's Manual                                                             BACKTRACE(3)

NAME
       backtrace, backtrace_symbols, backtrace_symbols_fd - support for application self-debugging

SYNOPSIS
       #include <execinfo.h>

       int backtrace(void **buffer, int size);

       char **backtrace_symbols(void *const *buffer, int size);

       void backtrace_symbols_fd(void *const *buffer, int size, int fd);

DESCRIPTION
       backtrace()  returns  a  backtrace  for the calling program, in the array pointed to by buffer.  A backtrace is the series of currently active function calls for the program.  Each item in the array pointed to by buffer is of type void *, and is the return address from the corresponding stack frame.  The size  argument  specifies the  maximum  number of addresses that can be stored in buffer.  If the backtrace is larger than size, then the addresses corresponding to the size most recent function calls are returned; to obtain the complete backtrace, make sure that buffer and size are large enough.

	   Given the set of addresses returned by backtrace() in buffer, backtrace_symbols() translates the addresses into an array of strings that describe the addresses  symbolically.  The size argument specifies the number of addresses in buffer.  The symbolic representation of each address consists of the function name (if this can be determined), a hexadecimal offset into the function, and the actual return address (in hexadecimal).  The address of the array of string pointers is returned as  the function  result of backtrace_symbols().  This array is malloc(3)ed by backtrace_symbols(), and must be freed by the caller.  (The strings pointed to by the array of pointers need not and should not be freed.)

       backtrace_symbols_fd() takes the same buffer and size arguments as backtrace_symbols(), but instead of returning an array of strings to the  caller,  it  writes  the strings,  one  per  line,  to the file descriptor fd.  			          backtrace_symbols_fd() does not call malloc(3), and so can be employed in situations where the latter function might fail, but see NOTES.

RETURN VALUE
       backtrace() returns the number of addresses returned in buffer, which is not greater than size.  If the return value is less than size, then the full  backtrace  was stored; if it is equal to size, then it may have been truncated, in which case the addresses of the oldest stack frames are not returned.

       On success, backtrace_symbols() returns a pointer to the array malloc(3)ed by the call; on error, NULL is returned.

VERSIONS
       backtrace(), backtrace_symbols(), and backtrace_symbols_fd() are provided in glibc since version 2.1.

ATTRIBUTES
       For an explanation of the terms used in this section, see attributes(7).

   ┌───────────────────────┬───────────────┬─────────┐
   │Interface              │ Attribute     │ Value   │
   ├───────────────────────┼───────────────┼─────────┤
   │backtrace(),           │ Thread safety │ MT-Safe │
   │backtrace_symbols(),   │               │         │
   │backtrace_symbols_fd() │               │         │
   └───────────────────────┴───────────────┴─────────┘
主要还是以下三个函数:
/* backtrace()返回调用程序的回溯信息,该信息在buffer所指向的数组中。 回溯是该程序的一系列当前活动的函数调用,程序的一系列活动函数调用。
	buffer所指向的数组中的每一项都是void *类型的,并且是相应堆栈帧的返回地址;
	size参数指定了buffer中可存储的最大地址数;
	如果回溯大于size,那么返回的是与最近的函数调用大小相对应的地址;为了获得完整的回溯,确保buffer和size都足够大;返回值是buffer中实际地址的数量,小于等于size。
*/
int backtrace(void **buffer, int size);

/* backtrace_symbols()主要用于将backtrace()buffer中这些地址翻译为一个描述地址的字符串数组。
	参数中buffer是由backtrace()返回的buffer,每项代表一个函数地址;
	size:为backtrace()返回的size;
	backtrace_symbols()会用字符串描述每个函数地址,字符串包括:函数名称,一个16进制偏移(offset),实际的返回地址(16进制)
*/
char **backtrace_symbols(void *const *buffer, int size);

/* backtrace_symbols_fd()作用与backtrace_symbols()作用类似,不同之处在于前者不会将翻译的字符串信息返回给调用者,二十写入fd文件描述符下的文件;
	fd:文件描述符句柄;
*/
void backtrace_symbols_fd(void *const *buffer, int size, int fd);
收集注意事项如下:**
- backtrace的实现依赖于栈指针(fp寄存器),在gcc编译过程中任何非零的优化等级(
-On参数)或加入了栈指针优化参数-fomit-frame-pointer后多将不能正确得到程序栈信息; - backtrace_symbols的实现需要符号名称的支持,在gcc编译过程中需要加入
-rdynamic参数; - 内联函数没有栈帧,它在编译过程中被展开在调用的位置;
- 尾调用优化(Tail-call Optimization)将复用当前函数栈,而不再生成新的函数栈,这将导致栈信息不能正确被获取;
- ARM架构下编译选项需要添加
-g -funwind-tables -ffunction-sections。
编译选项说明
arm-linux-gnueabihf-gcc  -O0 -rdynamic -g -funwind-tables -ffunction-sections -fno-stack-protector add.c -fPIC -shared -o xxx.so
arm-linux-gnueabihf-gcc  -O0 -rdynamic -g -funwind-tables -ffunction-sections -fno-stack-protector source.c  -L. -llib -Wl,-rpath=. -o xxxapp
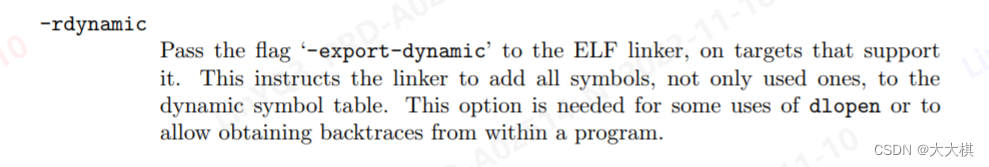
-
-rdynamic:用来通知链接器将所有符号添加到动态符号表中;
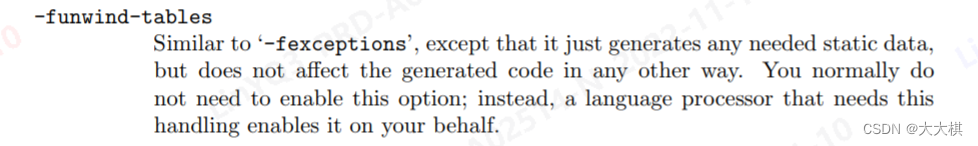
-
-funwind-tables:允许正在运行的程序从给定执行点向后退功能调用堆栈的数据(它只是生成任何所需的静态数据,但不会以任何其他方式影响生成的代码),用于简单地“窥视”调用者上下文;
-
-ffunction-sections:将为每个函数或符号创建一个sections,在链接阶段使用;
-
-fno-stack-protector:禁用栈保护措施,该选项打开主要是gcc编译的时候默认开启了栈保护,如果需要测试栈回溯且手动触发栈溢出这种情况时,需要提前禁用,否则将会出现自我保护,无法复现问题(非必须);
接口
#include <execinfo.h>

#define BACKTRACE_SIZE 16
static void dump(void)
{
    int j, nptrs;
    void *buffer[BACKTRACE_SIZE];
    char **strings;

    nptrs = backtrace(buffer, BACKTRACE_SIZE);

    printf("task backtrace() returned %d addresses\n", nptrs);

    strings = backtrace_symbols(buffer, nptrs);
    if (strings == NULL) {
        perror("backtrace_symbols");
        exit(EXIT_FAILURE);
    }
	if(nptrs)
	{
		printf("info: nptrs = %d\n", nptrs);
	}
	else
	{
		printf("Unable to get function name, nptrs = %d\n", nptrs);
	}

    for (j = 0; j < nptrs; j++)
        printf("  [%02d] %s\n", j, strings[j]);

    free(strings);
}

static void signal_handler(int signo)
{
    printf("\n=========>>> task catch signal %d <<<=========\n", signo);

    printf("Dump stack start...\n");
    dump();
    printf("Dump stack end...\n");

    signal(signo, SIG_DFL); /* 恢复信号默认处理 */
    raise(signo);           /* 重新发送信号 */
}
使用如上接口,只需要在主程序中添加signal监听即可,如本文主要是排查段错误发生位置,所以signal中要捕获的信号类型是SIGSEGV,如下:
signal(SIGSEGV, signal_handler);
弊端
经测试发现该定位手段存在几种情况下无法准确定位;
- 被static修饰过的函数、库文件;
- 栈空间内存出现溢出时导致的段错误;


 2417
2417


 被折叠的 条评论
为什么被折叠?
被折叠的 条评论
为什么被折叠?
 到【灌水乐园】发言


