


 该博客介绍了如何使用Python的json模块读取和写入JSON文件,通过pandas进行数据封装,并利用Plotly库进行数据可视化。示例展示了读取地震数据,提取关键信息如震级、经度和纬度,并创建全球地震分布的散点图。之后,使用pandas进一步处理数据,通过PlotlyExpress创建了以震级为大小和颜色依据的散点图,提供了更丰富的视觉效果。
说明
(1)JSON文件读取使用json模块all_eq_data = json.load(f)
写入使用:json.dump(all_eq_data,f,indent=4)
(2)数据封装使用pandas
(3)绘图使用plotly.express
JSON文件:

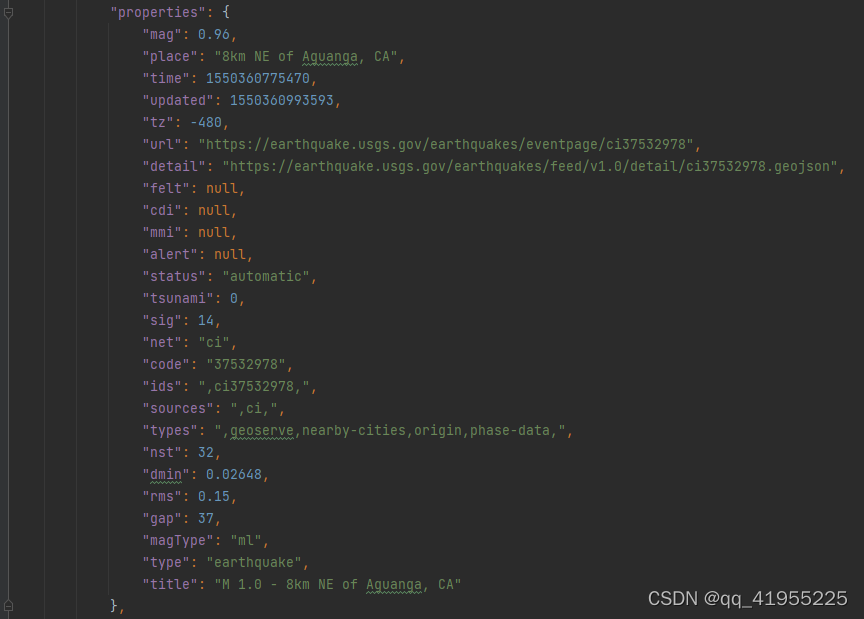
1 JSON文件读取
代码:
import json

filename="eq_data_1_day_m1.json"

with open(filename) as f:
    # 以字典的形式存储到all_eq_data中
    all_eq_data = json.load(f)

# readable_file="csv\mapping_global_data_sets\data/readable_eq_data.json"
# with open(readable_file,'w') as f:
#     #写入数据,参数 indent=4让 dump()使用与数据结构匹配的缩进量来设置数据的格式
#     json.dump(all_eq_data,f,indent=4)

all_eq_dicts = all_eq_data['features']
print(f"地震次数:{len(all_eq_dicts)}")

#提取信息
mags,titles,lons,lats=[],[],[],[]#存储地震级数,标题,经度,纬度信息
for eq_dict in all_eq_dicts:
    mag=eq_dict['properties']['mag']
    title=eq_dict['properties']['title']
    lon=eq_dict['geometry']['coordinates'][0]#经度
    lat=eq_dict['geometry']['coordinates'][1]#纬度
    mags.append((mag))#震级信息
    titles.append((title))#标题
    lons.append((lon))#经度
    lats.append((lat))#纬度

print(f"前10个地震级数信息mags:{mags[:10]}")#打印前10个震级
print(f"前2个标题信息titles:{titles[:2]}")#打印
print(f"前10个经度lons:{lons[:10]}")#打印
print(f"前10个纬度lats:{lats[:10]}")#打印
执行结果:
地震次数:158
前10个地震级数信息mags:[0.96, 1.2, 4.3, 3.6, 2.1, 4, 1.06, 2.3, 4.9, 1.8]
前2个标题信息titles:['M 1.0 - 8km NE of Aguanga, CA', 'M 1.2 - 11km NNE of North Nenana, Alaska']
前10个经度lons:[-116.7941667, -148.9865, -74.2343, -161.6801, -118.5316667, -144.1283, -116.7433333, -153.7845, 59.3991, -116.2045]
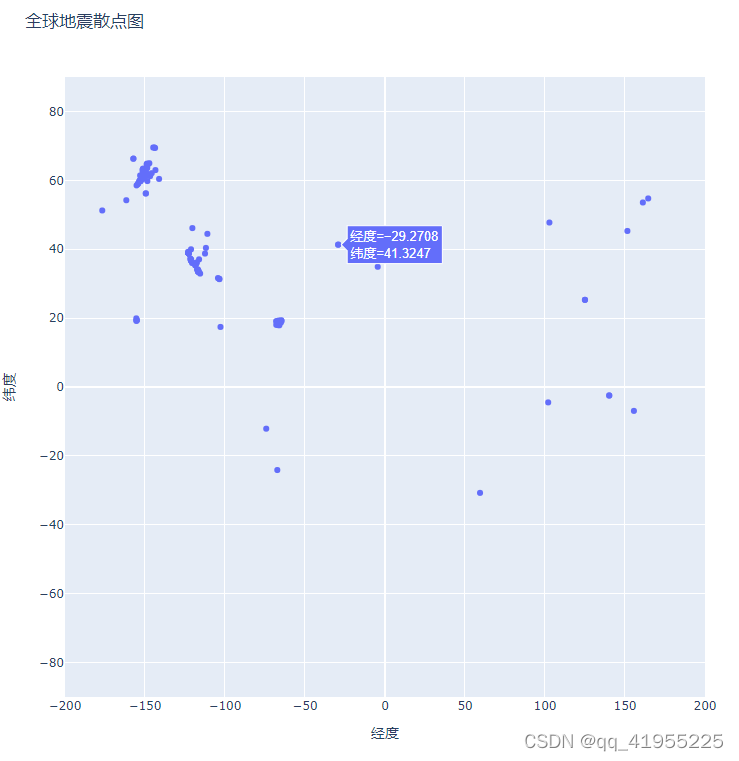
前10个纬度lats:[33.4863333, 64.6673, -12.1025, 54.2232, 35.3098333, 69.5346, 33.5148333, 59.6106, -30.7399, 37.0572]2 可视化
代码:
'''使用Plotly Express进行数据可视化'''
#import Plotly 的高级接口Plotly Express
import plotly.express as px
fig=px.scatter(
    x=lons,#x坐标数据
    y=lats,#y坐标数据
    labels={'x':'经度','y':'纬度'},#x,y轴label
    range_x=[-200,200],#x轴范围
    range_y=[-90,90],#y轴范围
    width=800,#像素
    height=800,#像素
    title='全球地震散点图',#标题
)
fig.write_html('global_earthquakes.html')
fig.show()
执行结果:
3 pandas数据处理后可视化
代码:
'''使用pandas可视化'''
import pandas as pd
#import Plotly 的高级接口Plotly Express
import plotly.express as px
#封装数据
data=pd.DataFrame(
data=zip(lons,lats,titles,mags),columns=['经度','纬度','位置','震级']
)
data.head()
print(f"pd封装后:\n{data}")
#默认的视觉映射图例渐变色范围是从蓝到红再到黄
#打印渐变的选择,使用 px.colors.diverging.RdYlGn[::-1]可以将对应的颜色的配色列表反转
for key in px.colors.named_colorscales():
print(f"Plotly Express渐变选项:{key}")
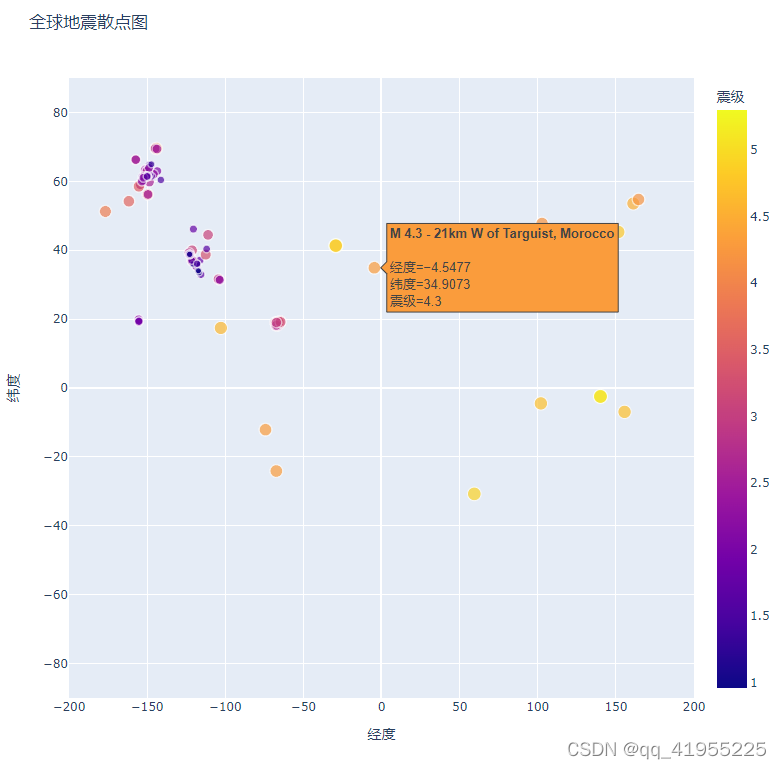
fig=px.scatter(
data,#传递封装后的数据
x='经度',#x坐标数据
y='纬度',#y坐标数据
labels={'x':'经度','y':'纬度'},#x,y轴label
range_x=[-200,200],#x轴范围
range_y=[-90,90],#y轴范围
width=800,#像素
height=800,#像素
title='全球地震散点图',#标题
size='震级',#指定散点图中每个标记的尺寸,标记尺寸默认为 20 像素,可以通过size_max重新设置
size_max=10,#通过 size_max=10 将最大显示尺寸缩放到10
color='震级', #标记的震级按照不同的颜色显示;默认的视觉映射图例渐变色范围是从蓝到红再到黄,数值越小则标记越蓝,而数值越大则标记越黄
hover_name='位置',# hover_name显示震级的位置
)
fig.write_html('global_earthquakes_pd.html')
fig.show()
结果:
pd封装后:
             经度  ...    震级
0   -116.794167  ...  0.96
1   -148.986500  ...  1.20
2    -74.234300  ...  4.30
3   -161.680100  ...  3.60
4   -118.531667  ...  2.10
..          ...  ...   ...
153  -64.617600  ...  3.20
154 -149.982000  ...  1.60
155 -141.198500  ...  1.50
156 -147.289800  ...  1.30
157  -67.226300  ...  2.96

[158 rows x 4 columns]


Plotly Express渐变选项:aggrnyl
Plotly Express渐变选项:agsunset
Plotly Express渐变选项:blackbody
Plotly Express渐变选项:bluered
Plotly Express渐变选项:blues
Plotly Express渐变选项:blugrn
Plotly Express渐变选项:bluyl
...
参考书籍《python 编程:从入门到实践》


 1132
1132

 被折叠的 条评论
为什么被折叠?
被折叠的 条评论
为什么被折叠?
 到【灌水乐园】发言


