


 本文详细介绍了2022年5月更新的SMU激活函数,对比了Sigmoid、Tanh、ReLU等经典激活函数,重点展示了SMU如何通过改进克服ReLU问题,提升模型性能。
2022.05.26更新
- 增加SMU激活函数
前言
激活函数是一种添加到人工神经网络中的函数,类似于人类大脑中基于神经元的模型,激活函数最终决定了要发射给下一个神经元的内容。
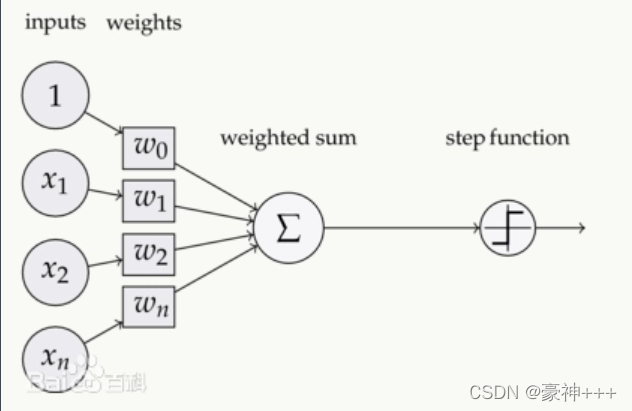
此图来自百度百科,其中step function就是激活函数,它是对之前一层进行汇总后信号进行激活,传给下一层神经元。
常用的激活函数有以下10个:
常用的10个激活函数
- Sigmoid
- Tanh
- ReLU
- Softmax
- Leaky ReLU
- ELU
- PReLU
- Swish
- Squareplus
- SMU
1. Sigmoid

如上图是Sigmoid函数的函数图像。
Sigmoid 函数的图像看起来像一个 S 形曲线。
公式:
f
(
x
)
=
1
1
+
e
−
x
f(x)=\frac 1{1+e^{-x}}
f(x)=1+e−x1
特点:
- Sigmoid 函数的输出范围是 0 到 1。由于输出值在 0 到 1,所以它可以对每个神经元的输出进行了归一化。
- 因为Sigmoid 函数的输出范围是 0 到 1,所以可以用于将预测概率作为输出的模型。
- 梯度平滑,避免跳跃的输出值。
- 容易梯度消失。
- 函数输出不是以 0 为中心的,这会降低权重更新的效率。
- Sigmoid 函数是指数运算,计算机运行得较慢。
代码演示:
import matplotlib.pyplot as plt
import numpy as np

def sigmoid(x):
    return 1 / (1 + np.exp(-x))

fig, ax = plt.subplots()

x = np.linspace(-10, 10, 100)
y = sigmoid(x)

ax.plot(x, y)
# 画轴
ax.spines['top'].set_color('none')
ax.spines['right'].set_color('none')

ax.spines['bottom'].set_position(('data', 0))
ax.spines['left'].set_position(('axes', 0.5))
plt.grid() # 设置方格
plt.title("Sigmoid")
plt.show()
2. Tanh

如上图是Tanh函数的函数图像。
Tanh 函数的图像看起来像一个有点扁的 S 形曲线。Tanh 是一个双曲正切函数。Tanh 函数和 Sigmoid 函数的曲线相对相似。但是它比 Sigmoid 函数更有一些优势。
公式:
f
(
x
)
=
2
1
+
e
−
2
x
−
1
f(x)=\frac 2{1+e^{-2x}}-1
f(x)=1+e−2x2−1
特点:
- 首先,当输入较大或较小时,输出几乎是平滑的并且梯度较小,这不利于权重更新。二者的区别在于输出间隔,Tanh 的输出间隔为 1,并且整个函数以 0 为中心,比 Sigmoid 函数更好。
- 在 Tanh 图中,负数信号输入,输出也是负数信号。
- 在一般的二元分类问题中,Tanh 函数用于隐藏层,而 Sigmoid 函数用于输出层,但这并不是固定的,需要根据特定问题进行调整。
代码演示:
import matplotlib.pyplot as plt
import numpy as np

def sigmoid(x):
    return 1 / (1 + np.exp(-x))

def tanh(x):
    return 2 / (1 + np.exp(-2*x)) - 1

fig, ax = plt.subplots()

x = np.linspace(-10, 10, 100)
y1 = tanh(x)

y2 = sigmoid(x)

ax.plot(x, y1, '-b', label='Tanh')
ax.plot(x, y2, '-r', label='Sigmoid')
ax.legend() # 设置图例
# 画轴
ax.spines['top'].set_color('none')
ax.spines['right'].set_color('none')

ax.spines['bottom'].set_position(('data', 0))
ax.spines['left'].set_position(('axes', 0.5))
plt.grid() # 设置方格
plt.title("Tanh and Sigmoid")
plt.show()
3. ReLU

如上图是ReLU函数的函数图像。
ReLU 函数是深度学习中较为流行的一种激活函数。
公式:
f
(
x
)
=
{
m
a
x
(
0
,
x
)
x ≥ 0
0
x < 0
f(x)= \begin{cases} {max(0, x)}&\text{x ≥ 0}\\ 0& \text{x < 0} \end{cases}
f(x)={max(0,x)0x ≥ 0x < 0
特点:
- 当输入为正时,不存在梯度饱和问题。
- 计算速度快。ReLU 函数中只存在线性关系,因此它的计算速度比 sigmoid 和 tanh 更快。
- 当输入为负时,ReLU 完全失效,在正向传播过程中,这不是问题。有些区域很敏感,有些则不敏感。但是在反向传播过程中,如果输入负数,则梯度将完全为零。
代码演示:
import matplotlib.pyplot as plt
import numpy as np

def relu(x):
    return np.maximum(0, x)

fig, ax = plt.subplots()

x = np.linspace(-10, 10, 100)
y = relu(x)
ax.plot(x, y, '-r', linewidth=4)
ax.legend() # 设置图例
# 画轴
ax.spines['top'].set_color('none')
ax.spines['right'].set_color('none')

ax.spines['bottom'].set_position(('data', 0))
ax.spines['left'].set_position(('axes', 0.5))
plt.grid() # 设置方格
plt.title("ReLU")
plt.show()
4. Softmax

如上图是Softmax函数的函数图像。
公式:
e
x
i
∑
j
=
1
n
e
x
j
\frac {e^{x_i}}{\sum_{j=1}^ne^{x_j}}
∑j=1nexjexi
特点:
- 在零点不可微。
- 负数信号输入的梯度为零,这意味着对于该区域的激活,权重不会在反向传播期间更新,因此会产生永不激活的死亡神经元。
- Softmax 函数的分母结合了原始输出值的所有因子,这意味着 Softmax 函数获得的各种概率彼此相关,因此Softmax 是用于多类分类问题。
代码演示
import matplotlib.pyplot as plt
import numpy as np

def softmax(x):
    x = np.exp(x) / np.sum(np.exp(x))
    return x
fig, ax = plt.subplots()

x = np.linspace(-10, 10, 100)
y = softmax(x)
ax.plot(x, y)
ax.legend() # 设置图例
# 画轴
ax.spines['top'].set_color('none')
ax.spines['right'].set_color('none')

ax.spines['bottom'].set_position(('data', 0))
ax.spines['left'].set_position(('axes', 0.5))
plt.grid() # 设置方格
plt.title("Softmax")
plt.show()
5. Leaky ReLU

如上图是Leaky ReLU函数的函数图像。
它是一种专门设计用于解决 ReLU 梯度消失问题的激活函数。
公式:
f
(
x
)
=
{
x
x ≥ 0
a
x
x < 0
f(x)= \begin{cases} {x}&\text{x ≥ 0}\\ {ax}& \text{x < 0} \end{cases}
f(x)={xaxx ≥ 0x < 0
特点:
- Leaky ReLU 通过把 x 的非常小的线性分量给予负数信号来调整负值的零梯度问题。
- leak 有助于扩大 ReLU 函数的范围,通常 a 的值为 0.01 左右。
注意: 从理论上讲,Leaky ReLU 具有 ReLU 的所有优点,而且 Dead ReLU 不会有任何问题,但在实际操作中,尚未完全证明 Leaky ReLU 总是比 ReLU 更好。
代码演示:
import matplotlib.pyplot as plt
import numpy as np

def leaky_relu(x,a=0.01):
    return np.maximum(a*x, x)

fig, ax = plt.subplots()

x = np.linspace(-10, 10, 100)
y = leaky_relu(x)
ax.plot(x, y)
ax.legend() # 设置图例
# 画轴
ax.spines['top'].set_color('none')
ax.spines['right'].set_color('none')

ax.spines['bottom'].set_position(('data', 0))
ax.spines['left'].set_position(('axes', 0.5))
plt.grid() # 设置方格
plt.title("Leaky ReLu")
plt.show()
6. ELU

如上图是ELU函数的函数图像。
ELU 的提出也解决了 ReLU 的问题。与 ReLU 相比,ELU 有负值,这会使激活的平均值接近零。均值激活接近于零可以使学习更快,因为它们使梯度更接近自然梯度。
公式:
f
(
x
)
=
{
x
x ≥ 0
α
(
e
x
−
1
)
x < 0
f(x)= \begin{cases} {x}&\text{x ≥ 0}\\ {\alpha(e^x - 1)}& \text{x < 0} \end{cases}
f(x)={xα(ex−1)x ≥ 0x < 0
特点:
- ELU 通过减少偏置偏移的影响,使正常梯度更接近于单位自然梯度,从而使均值向零加速学习。
- ELU 在较小的输入下会饱和至负值,从而减少前向传播的变异和信息。
注意: 它的计算强度更高。与 Leaky ReLU 类似,尽管理论上比 ReLU 要好,但目前在实践中没有充分的证据表明 ELU 总是比 ReLU 好。
代码演示:
import matplotlib.pyplot as plt
import numpy as np

def elu(x,alpha=1):
    a = x[x>0]
    b = alpha*(np.exp(x[x<0])-1)
    result=np.concatenate((b,a),axis=0)
    return result

fig, ax = plt.subplots()

x = np.linspace(-10, 10, 100)
y = elu(x)
ax.plot(x, y)
ax.legend() # 设置图例
# 画轴
ax.spines['top'].set_color('none')
ax.spines['right'].set_color('none')

ax.spines['bottom'].set_position(('data', 0))
ax.spines['left'].set_position(('axes', 0.5))
plt.grid() # 设置方格
plt.title("ELU")
plt.show()
7. PReLU

PReLU 也是 ReLU 的改进版本。
公式:
f
(
x
)
=
{
x
x ≥ 0
α
x
x < 0
f(x)= \begin{cases} {x}&\text{x ≥ 0}\\ {\alpha x}& \text{x < 0} \end{cases}
f(x)={xαxx ≥ 0x < 0
若
α
\alpha
α是可学习的参数,则
f
(
x
)
f(x)
f(x)变为 PReLU。
特点:
- 与 ELU 相比,PReLU 在负值域是线性运算。尽管斜率很小,但不会趋于 0。
代码就不演示了,和上面得Leaky ReLU一样。
8. Swish

如上图是Swish函数的函数图像。
Swish 的设计受到了 LSTM 和高速网络中 gating 的 sigmoid 函数使用的启发。我们使用相同的 gating 值来简化 gating 机制,这称为 self-gating。
self-gating 的优点在于它只需要简单的标量输入,而普通的 gating 则需要多个标量输入。这使得诸如 Swish 之类的 self-gated 激活函数能够轻松替换以单个标量为输入的激活函数(例如 ReLU),而无需更改隐藏容量或参数数量。
公式:
y
=
x
∗
s
i
g
m
o
i
d
(
x
)
y = x * sigmoid (x)
y=x∗sigmoid(x)
特点:
- 无界性有助于防止慢速训练期间,梯度逐渐接近 0 并导致饱和;(同时,有界性也是有优势的,因为有界激活函数可以具有很强的正则化,并且较大的负输入问题也能解决)。
- 导数恒大于零。
- 平滑度在优化和泛化中起了重要作用。
代码演示:
import matplotlib.pyplot as plt
import numpy as np

def sigmoid(x):
    return 1 / (1 + np.exp(-x))

def swish(x):
    return sigmoid(x) * x

fig, ax = plt.subplots()

x = np.linspace(-10, 10, 100)
y = swish(x)
ax.plot(x, y)
ax.legend() # 设置图例
# 画轴
ax.spines['top'].set_color('none')
ax.spines['right'].set_color('none')

ax.spines['bottom'].set_position(('data', 0))
ax.spines['left'].set_position(('axes', 0.5))
plt.grid() # 设置方格
plt.title("Swish")
plt.show()
9. Squareplus

如上图是Squareplus函数的函数图像。
Squareplus是Softplus优化版本,Squareplus由超参数b>0定义,它决定了x=0附近弯曲区域的大小。
公式:
y
=
1
2
(
x
+
x
2
+
b
)
y=\frac 1{2}(x+\sqrt{x^2+b})
y=21(x+x2+b)
特点:
- 它的输出是非负的。
- 它是ReLU的一个上界函数,会随着|x|的增长而接近ReLU。
- 它是连续的。
- Squareplus只使用代数运算进行计算,这使得它非常适合计算资源或指令集有限的情况。此外,当x较大时,Squareplus无需特别考虑确保数值稳定性。
代码演示:
import numpy as np
import matplotlib.pyplot as plt

def Squareplus(x, b=0.2):
    x = 0.5 * (x + np.sqrt(x**2+b))
    return x

fig, ax = plt.subplots()

x = np.linspace(-10, 10, 100)
y = Squareplus(x)
ax.plot(x, y)
ax.legend() # 设置图例
# 画轴
ax.spines['top'].set_color('none')
ax.spines['right'].set_color('none')

ax.spines['bottom'].set_position(('data', 0))
ax.spines['left'].set_position(('axes', 0.5))
plt.grid() # 设置方格
plt.title("Squareplus")
plt.show()
10. SMU
该函数是在已知激活函数Leaky ReLU近似的基础上,提出了一种新的激活函数,称之为Smooth Maximum Unit(SMU)。用SMU替换ReLU,ShuffleNet V2模型在CIFAR100数据集上得到了6.22%的提升。
参考:https://github.com/iFe1er/SMU_pytorch
tensorflow2.x代码如下:
import tensorflow as tf

def SMU(x,alpha=0.25):
    mu = tf.compat.v1.get_variable('SMU_mu', shape=(),
                       initializer=tf.constant_initializer(1000000),
                       dtype=tf.float32)
    return ((1+alpha)*x + (1-alpha)*x*tf.math.erf(mu*(1-alpha)*x))/2

def SMU1(x,alpha=0.25):
    mu = tf.compat.v1.get_variable('SMU1_mu', shape=(),
                       initializer=tf.constant_initializer(4.352665993287951e-9),
                       dtype=tf.float32)
    return ((1+alpha)*x+tf.math.sqrt(tf.math.square(x-alpha*x)+tf.math.square(mu)))/2
pytorch代码如下:
import torch
from torch import nn

class SMU(nn.Module):
    '''
    Implementation of SMU activation.
    Shape:
        - Input: (N, *) where * means, any number of additional
          dimensions
        - Output: (N, *), same shape as the input
    Parameters:
        - alpha: hyper parameter
    References:
        - See related paper:
        https://arxiv.org/abs/2111.04682
    Examples:
        >>> smu = SMU()
        >>> x = torch.Tensor([0.6,-0.3])
        >>> x = smu(x)
    '''
    def __init__(self, alpha = 0.25):
        '''
        Initialization.
        INPUT:
            - alpha: hyper parameter
            aplha is initialized with zero value by default
        '''
        super(SMU,self).__init__()
        self.alpha = alpha
        # initialize mu
        self.mu = torch.nn.Parameter(torch.tensor(1000000.0))

    def forward(self, x):
        return ((1+self.alpha)*x + (1-self.alpha)*x*torch.erf(self.mu*(1-self.alpha)*x))/2


class SMU1(nn.Module):
    '''
    Implementation of SMU-1 activation.
    Shape:
        - Input: (N, *) where * means, any number of additional
          dimensions
        - Output: (N, *), same shape as the input
    Parameters:
        - alpha: hyper parameter
    References:
        - See related paper:
        https://arxiv.org/abs/2111.04682
    Examples:
        >>> smu1 = SMU1()
        >>> x = torch.Tensor([0.6,-0.3])
        >>> x = smu1(x)
    '''
    def __init__(self, alpha = 0.25):
        '''
        Initialization.
        INPUT:
            - alpha: hyper parameter
            aplha is initialized with zero value by default
        '''
        super(SMU1,self).__init__()
        self.alpha = alpha
        # initialize mu
        self.mu = torch.nn.Parameter(torch.tensor(4.352665993287951e-9))

    def forward(self, x):
        return ((1+self.alpha)*x+torch.sqrt(torch.square(x-self.alpha*x)+torch.square(self.mu)))/2


 1934
1934

 被折叠的 条评论
为什么被折叠?
被折叠的 条评论
为什么被折叠?
 到【灌水乐园】发言


