


 本文介绍了如何使用seaborn库对exercise.csv数据集中的pulse,diet,和time列进行多值分组,并通过不同方法(如直接计数和unstack后可视化)展示分组结果。展示了四个实例,逐步演示了从数据加载到结果可视化的完整过程。
在本文中,我们将学习如何按多个值分组并一次性绘制结果。在这里,我们从seaborn库中获取一个数据集的“exercise.csv”文件,然后形成不同的groupby数据并可视化结果。
对于此程序,所需步骤如下:
- 导入相关库
- 创建并导入具有多个列的数据
- 通过对多个值进行分组来形成groupby对象
- 可视化分组数据
下面是一些示例的实现:
示例1
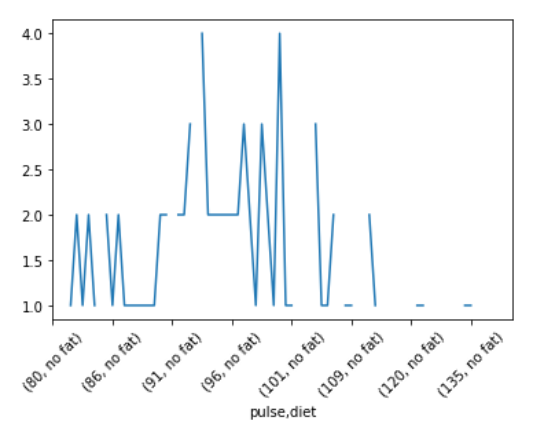
在这个例子中,我们从seaborn库中获取一个数据集的“exercise.csv”文件,然后根据“time”列将“pulse”和“diet”两列分组在一起,形成groupby数据,最后可视化结果。
# importing packages
import seaborn

# load dataset and view
data = seaborn.load_dataset('exercise')
print(data)

# multiple groupby (pulse and diet both)
df = data.groupby(['pulse', 'diet']).count()['time']
print(df)

# plot the result
df.plot()
plt.xticks(rotation=45)
plt.show()
输出
    Unnamed: 0  id     diet  pulse    time     kind
0            0   1  low fat     85   1 min     rest
1            1   1  low fat     85  15 min     rest
2            2   1  low fat     88  30 min     rest
3            3   2  low fat     90   1 min     rest
4            4   2  low fat     92  15 min     rest
..         ...  ..      ...    ...     ...      ...
85          85  29   no fat    135  15 min  running
86          86  29   no fat    130  30 min  running
87          87  30   no fat     99   1 min  running
88          88  30   no fat    111  15 min  running
89          89  30   no fat    150  30 min  running

[90 rows x 6 columns]
pulse  diet
80     no fat     NaN
       low fat    1.0
82     no fat     NaN
       low fat    1.0
83     no fat     2.0
                 ...
140    low fat    NaN
143    no fat     1.0
       low fat    NaN
150    no fat     1.0
       low fat    NaN
Name: time, Length: 78, dtype: float64
示例2
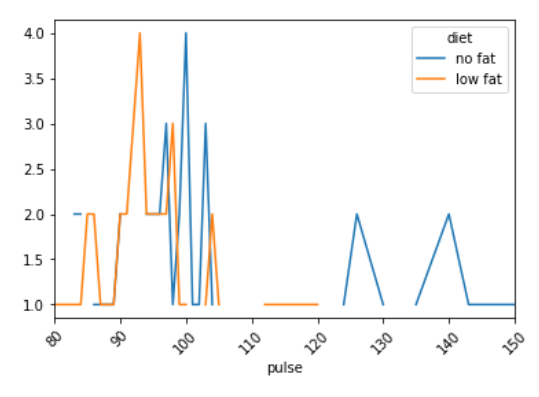
本示例是对上述示例的修改,以实现更好的可视化。
# importing packages
import seaborn

# load dataset
data = seaborn.load_dataset('exercise')

# multiple groupby (pulse and diet both)
df = data.groupby(['pulse', 'diet']).count()['time']

# plot the result
df.unstack().plot()
plt.xticks(rotation=45)
plt.show()
输出
示例3
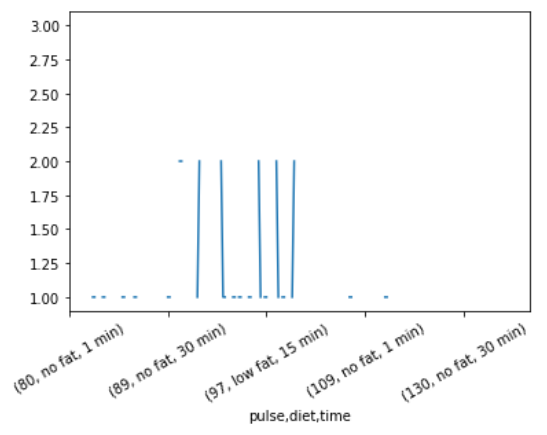
在这个例子中,我们从seaborn库中获取数据集的“exercise.csv”文件,然后通过将“pulse”,“diet”和“time”三列分组在一起形成groupby数据,最后将结果可视化。
# importing packages
import seaborn

# load dataset and view
data = seaborn.load_dataset('exercise')
print(data)

# multiple groupby (pulse, diet and time)
df = data.groupby(['pulse', 'diet', 'time']).count()['kind']
print(df)

# plot the result
df.plot()
plt.xticks(rotation=30)
plt.show()
输出
Unnamed: 0  id     diet  pulse    time     kind
0            0   1  low fat     85   1 min     rest
1            1   1  low fat     85  15 min     rest
2            2   1  low fat     88  30 min     rest
3            3   2  low fat     90   1 min     rest
4            4   2  low fat     92  15 min     rest
..         ...  ..      ...    ...     ...      ...
85          85  29   no fat    135  15 min  running
86          86  29   no fat    130  30 min  running
87          87  30   no fat     99   1 min  running
88          88  30   no fat    111  15 min  running
89          89  30   no fat    150  30 min  running

[90 rows x 6 columns]
pulse  diet     time
80     no fat   1 min     NaN
                15 min    NaN
                30 min    NaN
       low fat  1 min     1.0
                15 min    NaN
                         ...
150    no fat   15 min    NaN
                30 min    1.0
       low fat  1 min     NaN
                15 min    NaN
                30 min    NaN
Name: kind, Length: 234, dtype: float64
示例4
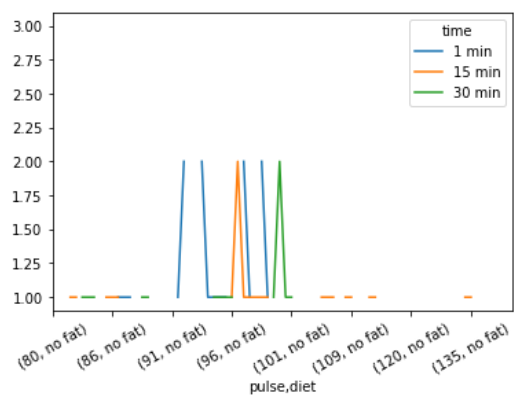
本示例是对上述示例的修改,以实现更好的可视化。
# importing packages
import seaborn

# load dataset
data = seaborn.load_dataset('exercise')

# multiple groupby (pulse, diet, and time)
df = data.groupby(['pulse', 'diet', 'time']).count()['kind']

# plot the result
df.unsatck().plot()
plt.xticks(rotation=30)
plt.show()
输出


 3万+
3万+


 被折叠的 条评论
为什么被折叠?
被折叠的 条评论
为什么被折叠?
 到【灌水乐园】发言


