


使用数据:uwnd.mon.ltm.1991-2020.nc
使用库:Matplotlib、NumPy、netCDF4、Cartopy
彩色图像

import matplotlib.pyplot as plt
import netCDF4 as nc
import numpy as np
import cartopy.mpl.ticker as cmt
plt.rcParams['font.sans-serif']= ['Microsoft YaHei'] # 设置“微软雅黑”,图上显示出中文
plt.rcParams['axes.unicode_minus'] = False # 设置中文后,解决坐标轴上负号显示问题
Rd = 287
Tv = 273
g = 9.8
p0 = 1013.2
Hp = Rd*Tv/g
def p2z(p):
'''p:array'''
return Hp*np.log(p0/p)
f = nc.Dataset(r"uwnd.mon.ltm.1991-2020.nc",'r')
level = f.variables['level'][:]
u = f.variables['uwnd'][:]
lat = f.variables['lat'][:]
time = nc.num2date(f.variables['time'][:],f.variables['time'].units).data
months = np.array([i.month for i in time])
z = p2z(level)
def pa(para_month):
index_month = np.where(months==para_month)[0][0] # 改月份
u = f.variables['uwnd'][:]
u = u[index_month][:,:,0]
Lat, Z = np.meshgrid(lat,z)
return Lat,Z,u
Lat1,Z1,u1=pa(1)
Lat2,Z2,u2=pa(7)
fig = plt.figure(figsize=[11,14])
#001
ax = plt.subplot(211)
levels = np.arange(-30,100,5)
ec = ax.contourf(Lat1,Z1, u1,cmap = 'rainbow',levels=levels)
ac = ax.contour(Lat1,Z1, u1,levels=levels,colors='black',linewidths=1,linestyles='-')
fig.colorbar(ec)
ax.clabel(ac)
# plt.title(time[:19])
#ax.set_xlabel('Latitude[°]')
ax.set_ylabel('level[hPa]')
ax.set_yticks(z[:11],level[:11].astype(int))
LAT=[-90, -60, -30, 0, 30, 60, 90]
ax.set_xticks(LAT)
ax.invert_xaxis()
ax.xaxis.set_major_formatter(cmt.LatitudeFormatter())#给横坐标加经度符号
plt.title("1月")
#002
ax = plt.subplot(212)
levels = np.arange(-30,100,5)
ec = ax.contourf(Lat2,Z2, u2,cmap = 'rainbow',levels=levels)
ac = ax.contour(Lat2,Z2, u2,levels=levels,colors='black',linewidths=1,linestyles='-')
fig.colorbar(ec)
ax.clabel(ac)
# plt.title(time[:19])
ax.set_xlabel('Latitude[°]')
ax.set_ylabel('level[hPa]')
ax.set_yticks(z[:11],level[:11].astype(int))
LAT=[-90, -60, -30, 0, 30, 60, 90]
ax.set_xticks(LAT)
ax.invert_xaxis()
ax.xaxis.set_major_formatter(cmt.LatitudeFormatter())#给横坐标加经度符号
plt.title("7月")
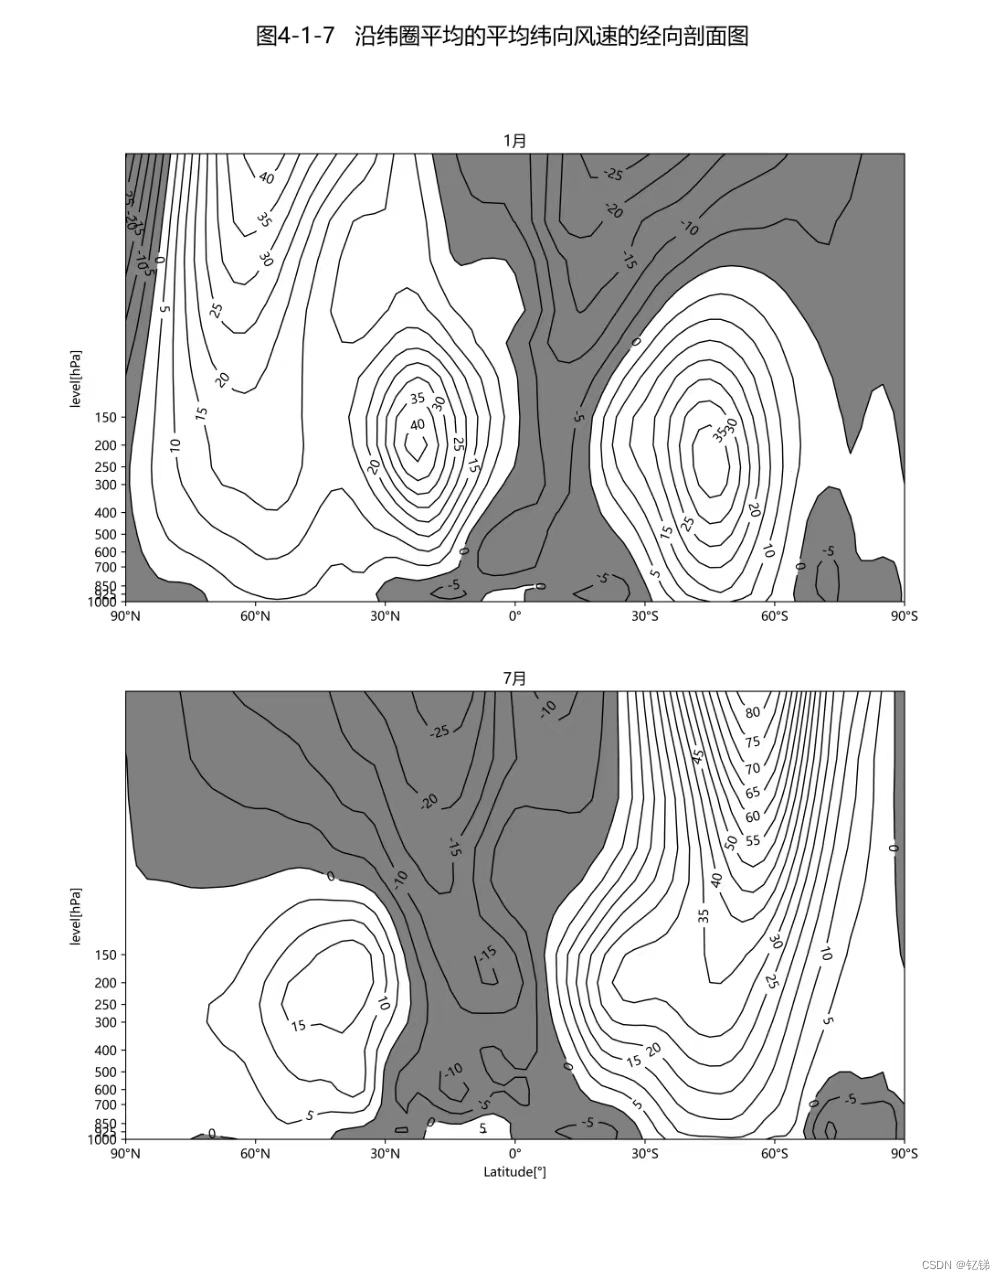
plt.suptitle("图4-1-7 沿纬圈平均的平均纬向风速的经向剖面图",fontsize='xx-large')
plt.savefig("图4-1-7.png",dpi=800)
plt.show()
黑白图像
import matplotlib.pyplot as plt
import netCDF4 as nc
import numpy as np
import cartopy.mpl.ticker as cmt

plt.rcParams['font.sans-serif']= ['Microsoft YaHei'] # 设置“微软雅黑”,图上显示出中文
plt.rcParams['axes.unicode_minus'] = False # 设置中文后,解决坐标轴上负号显示问题

Rd = 287
Tv = 273
g = 9.8
p0 = 1013.2
Hp = Rd*Tv/g
def p2z(p):
    '''p:array'''
    return Hp*np.log(p0/p)

f = nc.Dataset(r"uwnd.mon.ltm.1991-2020.nc",'r')
level = f.variables['level'][:]
u = f.variables['uwnd'][:]
lat = f.variables['lat'][:]
time = nc.num2date(f.variables['time'][:],f.variables['time'].units).data
months = np.array([i.month for i in time])
z = p2z(level)
def pa(para_month):
    index_month = np.where(months==para_month)[0][0] # 改月份
    u = f.variables['uwnd'][:]
    u = u[index_month][:,:,0]
    Lat, Z = np.meshgrid(lat,z)

    return Lat,Z,u

Lat1,Z1,u1=pa(1)
Lat2,Z2,u2=pa(7)
fig = plt.figure(figsize=[11,14])

#001
ax = plt.subplot(211)
levels = np.arange(0,100,90)
levels2 = np.arange(-30,90,5)
ec = ax.contourf(Lat1,Z1, -u1,cmap = 'gray',levels=levels)
ac = ax.contour(Lat1,Z1, u1,levels=levels2,colors='black',linewidths=1,linestyles='-')
#fig.colorbar(ec)
ax.clabel(ac)
# plt.title(time[:19])
#ax.set_xlabel('Latitude[°]')
ax.set_ylabel('level[hPa]')
ax.set_yticks(z[:11],level[:11].astype(int))
LAT=[-90, -60, -30, 0, 30, 60, 90]
ax.set_xticks(LAT)
ax.invert_xaxis()
ax.xaxis.set_major_formatter(cmt.LatitudeFormatter())#给横坐标加经度符号
plt.title("1月")

#002
ax = plt.subplot(212)
levels = np.arange(0,100,90)
ec = ax.contourf(Lat2,Z2, -u2,cmap = 'gray',levels=levels)
ac = ax.contour(Lat2,Z2, u2,levels=levels2,colors='black',linewidths=1,linestyles='-')
#fig.colorbar(ec)
ax.clabel(ac)
# plt.title(time[:19])
ax.set_xlabel('Latitude[°]')
ax.set_ylabel('level[hPa]')
ax.set_yticks(z[:11],level[:11].astype(int))
LAT=[-90, -60, -30, 0, 30, 60, 90]
ax.set_xticks(LAT)
ax.invert_xaxis()
ax.xaxis.set_major_formatter(cmt.LatitudeFormatter())#给横坐标加经度符号
plt.title("7月")
plt.suptitle("图4-1-7   沿纬圈平均的平均纬向风速的经向剖面图",fontsize='xx-large')

plt.savefig("图4-1-7(黑白).png",dpi=800)
plt.show()


 6933
6933


 被折叠的 条评论
为什么被折叠?
被折叠的 条评论
为什么被折叠?
 到【灌水乐园】发言


