


环境
- 单台物理机安装ELK(未配置集群)
- Kibana使用略
ES安装配置
- wget ‘https://artifacts.elastic.co/downloads/elasticsearch/elasticsearch-7.13.2-linux-x86_64.tar.gz’
- tar -zvf elasticsearch-7.13.2-linux-x86_64.tar.gz -C /opt/
- vim /opt/elasticsearch-7.13.2/config/elasticsearch.yml .修改http.port: 9050 & network.host: 0.0.0.0 & cluster.initial_master_nodes: [“localhost”] & path.data: /data/es
# ======================== Elasticsearch Configuration =========================
#
# NOTE: Elasticsearch comes with reasonable defaults for most settings.
#       Before you set out to tweak and tune the configuration, make sure you
#       understand what are you trying to accomplish and the consequences.
#
# The primary way of configuring a node is via this file. This template lists
# the most important settings you may want to configure for a production cluster.
#
# Please consult the documentation for further information on configuration options:
# https://www.elastic.co/guide/en/elasticsearch/reference/index.html
#
# ---------------------------------- Cluster -----------------------------------
#
# Use a descriptive name for your cluster:
#
#cluster.name: my-application
#
# ------------------------------------ Node ------------------------------------
#
# Use a descriptive name for the node:
#
#node.name: node-1
#
# Add custom attributes to the node:
#
#node.attr.rack: r1
#
# ----------------------------------- Paths ------------------------------------
#
# Path to directory where to store the data (separate multiple locations by comma):
#
path.data: /data/es
#
# Path to log files:
#
#path.logs: /path/to/logs
#
# ----------------------------------- Memory -----------------------------------
#
# Lock the memory on startup:
#
#bootstrap.memory_lock: true
#
# Make sure that the heap size is set to about half the memory available
# on the system and that the owner of the process is allowed to use this
# limit.
#
# Elasticsearch performs poorly when the system is swapping the memory.
#
# ---------------------------------- Network -----------------------------------
#
# By default Elasticsearch is only accessible on localhost. Set a different
# address here to expose this node on the network:
#
#network.host: 192.168.0.1
network.host: 0.0.0.0
#
# By default Elasticsearch listens for HTTP traffic on the first free port it
# finds starting at 9200. Set a specific HTTP port here:
#
http.port: 9050
#
# For more information, consult the network module documentation.
#
# --------------------------------- Discovery ----------------------------------
#
# Pass an initial list of hosts to perform discovery when this node is started:
# The default list of hosts is ["127.0.0.1", "[::1]"]
#
#discovery.seed_hosts: ["host1", "host2"]
#
# Bootstrap the cluster using an initial set of master-eligible nodes:
#
#cluster.initial_master_nodes: ["node-1", "node-2"]
cluster.initial_master_nodes: ["localhost"]
#
# For more information, consult the discovery and cluster formation module documentation.
#
# ---------------------------------- Various -----------------------------------
#
# Require explicit names when deleting indices:
#
#action.destructive_requires_name: true
4.切换到非root用户并启动ES
安装Kibana
- wget ‘https://artifacts.elastic.co/downloads/kibana/kibana-7.13.2-linux-x86_64.tar.gz’
- tar -zxvf kibana-7.13.2-linux-x86_64.tar.gz -C /opt
- /opt/kibana-7.13.2-linux-x86_64/config/kibana.yml.修改***server.port: 9030 & server.host: “0.0.0.0” & elasticsearch.hosts: [“http://localhost:9050”]***
# Kibana is served by a back end server. This setting specifies the port to use.
server.port: 9030

# Specifies the address to which the Kibana server will bind. IP addresses and host names are both valid values.
# The default is 'localhost', which usually means remote machines will not be able to connect.
# To allow connections from remote users, set this parameter to a non-loopback address.
server.host: "0.0.0.0"

# Enables you to specify a path to mount Kibana at if you are running behind a proxy.
# Use the `server.rewriteBasePath` setting to tell Kibana if it should remove the basePath
# from requests it receives, and to prevent a deprecation warning at startup.
# This setting cannot end in a slash.
#server.basePath: ""

# Specifies whether Kibana should rewrite requests that are prefixed with
# `server.basePath` or require that they are rewritten by your reverse proxy.
# This setting was effectively always `false` before Kibana 6.3 and will
# default to `true` starting in Kibana 7.0.
#server.rewriteBasePath: false

# Specifies the public URL at which Kibana is available for end users. If
# `server.basePath` is configured this URL should end with the same basePath.
#server.publicBaseUrl: ""

# The maximum payload size in bytes for incoming server requests.
#server.maxPayload: 1048576

# The Kibana server's name.  This is used for display purposes.
#server.name: "your-hostname"

# The URLs of the Elasticsearch instances to use for all your queries.
elasticsearch.hosts: ["http://localhost:9050"]

# Kibana uses an index in Elasticsearch to store saved searches, visualizations and
# dashboards. Kibana creates a new index if the index doesn't already exist.
#kibana.index: ".kibana"

# The default application to load.
#kibana.defaultAppId: "home"

# If your Elasticsearch is protected with basic authentication, these settings provide
# the username and password that the Kibana server uses to perform maintenance on the Kibana
# index at startup. Your Kibana users still need to authenticate with Elasticsearch, which
# is proxied through the Kibana server.
#elasticsearch.username: "kibana_system"
#elasticsearch.password: "pass"

# Enables SSL and paths to the PEM-format SSL certificate and SSL key files, respectively.
# These settings enable SSL for outgoing requests from the Kibana server to the browser.
#server.ssl.enabled: false
#server.ssl.certificate: /path/to/your/server.crt
#server.ssl.key: /path/to/your/server.key

# Optional settings that provide the paths to the PEM-format SSL certificate and key files.
# These files are used to verify the identity of Kibana to Elasticsearch and are required when
# xpack.security.http.ssl.client_authentication in Elasticsearch is set to required.
#elasticsearch.ssl.certificate: /path/to/your/client.crt
#elasticsearch.ssl.key: /path/to/your/client.key

# Optional setting that enables you to specify a path to the PEM file for the certificate
# authority for your Elasticsearch instance.
#elasticsearch.ssl.certificateAuthorities: [ "/path/to/your/CA.pem" ]

# To disregard the validity of SSL certificates, change this setting's value to 'none'.
#elasticsearch.ssl.verificationMode: full

# Time in milliseconds to wait for Elasticsearch to respond to pings. Defaults to the value of
# the elasticsearch.requestTimeout setting.
#elasticsearch.pingTimeout: 1500

# Time in milliseconds to wait for responses from the back end or Elasticsearch. This value
# must be a positive integer.
#elasticsearch.requestTimeout: 30000

# List of Kibana client-side headers to send to Elasticsearch. To send *no* client-side
# headers, set this value to [] (an empty list).
#elasticsearch.requestHeadersWhitelist: [ authorization ]

# Header names and values that are sent to Elasticsearch. Any custom headers cannot be overwritten
# by client-side headers, regardless of the elasticsearch.requestHeadersWhitelist configuration.
#elasticsearch.customHeaders: {}

# Time in milliseconds for Elasticsearch to wait for responses from shards. Set to 0 to disable.
#elasticsearch.shardTimeout: 30000

# Logs queries sent to Elasticsearch. Requires logging.verbose set to true.
#elasticsearch.logQueries: false

# Specifies the path where Kibana creates the process ID file.
#pid.file: /run/kibana/kibana.pid

# Enables you to specify a file where Kibana stores log output.
#logging.dest: stdout

# Set the value of this setting to true to suppress all logging output.
#logging.silent: false

# Set the value of this setting to true to suppress all logging output other than error messages.
#logging.quiet: false

# Set the value of this setting to true to log all events, including system usage information
# and all requests.
#logging.verbose: false

# Set the interval in milliseconds to sample system and process performance
# metrics. Minimum is 100ms. Defaults to 5000.
#ops.interval: 5000

# Specifies locale to be used for all localizable strings, dates and number formats.
# Supported languages are the following: English - en , by default , Chinese - zh-CN .
#i18n.locale: "en"
- root用户启动Kibana./opt/kibana-7.13.2-linux-x86_64/bin/kibana --allow-root &
$ 安装Logstash
- wget ‘https://artifacts.elastic.co/downloads/logstash/logstash-7.13.2-linux-x86_64.tar.gz’
- tar -xzvf logstash-7.13.2-linux-x86_64.tar.gz -C /opt
- cd /opt/logstash-7.13.2
- mkdir conf
- 新建文件logstash.conf
input {
    tcp {
        port => 9031
        codec => json_lines
    }
}
output{
  elasticsearch {
   hosts => ["localhost:9050"]
   index => "cms-farming-%{+YYYY.MM.dd}"
  }
  stdout { codec => rubydebug }
}
6.启动logstash. /opt/logstash-7.13.2/bin/logstash -f /opt/logstash-7.13.2/conf/logstash.conf
Springboot将日志输出到Logstsh
<?xml version="1.0" encoding="UTF-8" ?>
<configuration scan="true" scanPeriod="60 seconds" debug="true">


    <property name="log_dir" value="./logs" />
    <!-- 日志最大的历史 30天 -->
    <property name="maxHistory" value="30"/>


    <appender name="LOGSTASH" class="net.logstash.logback.appender.LogstashTcpSocketAppender">
        <destination>xxx.xxx.xxx.xxx:9031</destination>
        <encoder charset="UTF-8" class="net.logstash.logback.encoder.LogstashEncoder" />
    </appender>

    <appender name="STDOUT" class="ch.qos.logback.core.ConsoleAppender">
        <!-- 对日志进行格式化 -->
        <encoder>
            <pattern>%d{ISO8601} [%thread] [%-5level] %logger -%msg%n</pattern>
        </encoder>
    </appender>

    <!-- ERROR级别日志 -->
    <!-- 滚动记录文件,先将日志记录到指定文件,当符合某个条件时,将日志记录到其他文件 RollingFileAppender-->
    <appender name="ERROR" class="ch.qos.logback.core.rolling.RollingFileAppender">
        <!-- 过滤器,只记录WARN级别的日志 -->
        <filter class="ch.qos.logback.classic.filter.LevelFilter">
            <level>ERROR</level>
            <onMatch>ACCEPT</onMatch>
            <onMismatch>DENY</onMismatch>
        </filter>
        <!-- 最常用的滚动策略,它根据时间来制定滚动策略.既负责滚动也负责出发滚动 -->
        <rollingPolicy class="ch.qos.logback.core.rolling.TimeBasedRollingPolicy">
            <!--日志输出位置  可相对、和绝对路径 -->
            <fileNamePattern>${log_dir}/%d{yyyy-MM-dd}/error-log.log</fileNamePattern>
            <!-- 可选节点,控制保留的归档文件的最大数量,超出数量就删除旧文件假设设置每个月滚动,且<maxHistory>是6,
            则只保存最近6个月的文件,删除之前的旧文件。注意,删除旧文件是,那些为了归档而创建的目录也会被删除-->
            <maxHistory>${maxHistory}</maxHistory>
        </rollingPolicy>

        <!-- 按照固定窗口模式生成日志文件,当文件大于20MB时,生成新的日志文件。窗口大小是1到3,当保存了3个归档文件后,将覆盖最早的日志。
        <rollingPolicy class="ch.qos.logback.core.rolling.FixedWindowRollingPolicy">
          <fileNamePattern>${log_dir}/%d{yyyy-MM-dd}/.log.zip</fileNamePattern>
          <minIndex>1</minIndex>
          <maxIndex>3</maxIndex>
        </rollingPolicy>   -->
        <!-- 查看当前活动文件的大小,如果超过指定大小会告知RollingFileAppender 触发当前活动文件滚动
        <triggeringPolicy class="ch.qos.logback.core.rolling.SizeBasedTriggeringPolicy">
            <maxFileSize>5MB</maxFileSize>
        </triggeringPolicy>   -->

        <encoder>
            <pattern>%d{ISO8601} [%thread] [%-5level] %logger - %msg%n</pattern>
        </encoder>
    </appender>


    <!-- WARN级别日志 appender -->
    <appender name="WARN" class="ch.qos.logback.core.rolling.RollingFileAppender">
        <!-- 过滤器,只记录WARN级别的日志 -->
        <filter class="ch.qos.logback.classic.filter.LevelFilter">
            <level>WARN</level>
            <onMatch>ACCEPT</onMatch>
            <onMismatch>DENY</onMismatch>
        </filter>
        <rollingPolicy class="ch.qos.logback.core.rolling.TimeBasedRollingPolicy">
            <!-- 按天回滚 daily -->
            <fileNamePattern>${log_dir}/%d{yyyy-MM-dd}/warn-log.log
            </fileNamePattern>
            <!-- 日志最大的历史 30天 -->
            <maxHistory>${maxHistory}</maxHistory>
        </rollingPolicy>
        <encoder>
            <pattern>%d{ISO8601} [%thread] [%-5level] %logger - %msg%n</pattern>
        </encoder>
    </appender>


    <!-- INFO级别日志 appender -->
    <appender name="INFO" class="ch.qos.logback.core.rolling.RollingFileAppender">
        <!-- 过滤器,只记录INFO级别的日志 -->
        <filter class="ch.qos.logback.classic.filter.LevelFilter">
            <level>INFO</level>
            <onMatch>ACCEPT</onMatch>
            <onMismatch>DENY</onMismatch>
        </filter>
        <rollingPolicy class="ch.qos.logback.core.rolling.TimeBasedRollingPolicy">
            <!-- 按天回滚 daily -->
            <fileNamePattern>${log_dir}/%d{yyyy-MM-dd}/info-log.log
            </fileNamePattern>
            <!-- 日志最大的历史 30天 -->
            <maxHistory>${maxHistory}</maxHistory>
        </rollingPolicy>
        <encoder>
            <pattern>%d{ISO8601} [%thread] [%-5level] %logger - %msg%n</pattern>
        </encoder>
    </appender>


    <!-- DEBUG级别日志 appender -->
    <appender name="DEBUG" class="ch.qos.logback.core.rolling.RollingFileAppender">
        <!-- 过滤器,只记录DEBUG级别的日志 -->
        <filter class="ch.qos.logback.classic.filter.LevelFilter">
            <level>DEBUG</level>
            <onMatch>ACCEPT</onMatch>
            <onMismatch>DENY</onMismatch>
        </filter>
        <rollingPolicy class="ch.qos.logback.core.rolling.TimeBasedRollingPolicy">
            <!-- 按天回滚 daily -->
            <fileNamePattern>${log_dir}/%d{yyyy-MM-dd}/debug-log.log
            </fileNamePattern>
            <!-- 日志最大的历史 30天 -->
            <maxHistory>${maxHistory}</maxHistory>
        </rollingPolicy>
        <encoder>
            <pattern>%d{ISO8601} [%thread] [%-5level] %logger - %msg%n</pattern>
        </encoder>
    </appender>

    <!-- TRACE级别日志 appender -->
    <appender name="TRACE" class="ch.qos.logback.core.rolling.RollingFileAppender">
        <!-- 过滤器,只记录ERROR级别的日志 -->
        <filter class="ch.qos.logback.classic.filter.LevelFilter">
            <level>TRACE</level>
            <onMatch>ACCEPT</onMatch>
            <onMismatch>DENY</onMismatch>
        </filter>
        <rollingPolicy class="ch.qos.logback.core.rolling.TimeBasedRollingPolicy">
            <!-- 按天回滚 daily -->
            <fileNamePattern>${log_dir}/%d{yyyy-MM-dd}/trace-log.log
            </fileNamePattern>
            <!-- 日志最大的历史 60天 -->
            <maxHistory>${maxHistory}</maxHistory>
        </rollingPolicy>
        <encoder>
            <pattern>%d{ISO8601} [%thread] [%-5level] %logger - %msg%n</pattern>
        </encoder>
    </appender>

    <logger name="java.sql.PreparedStatement" value="DEBUG" />
    <logger name="java.sql.Connection" value="DEBUG" />
    <logger name="java.sql.Statement" value="DEBUG" />
    <logger name="com.ibatis" value="DEBUG" />
    <logger name="com.ibatis.common.jdbc.SimpleDataSource" value="DEBUG" />
    <logger name="com.ibatis.common.jdbc.ScriptRunner" level="DEBUG"/>
    <logger name="com.ibatis.sqlmap.engine.impl.SqlMapClientDelegate" value="DEBUG" />
    <logger name="com.atomikos" level="warn"/>
    <logger name="org.springframework" level="warn"/>
    <logger name="org.apache" level="warn"/>
    <logger name="ch.qos.logback" level="warn"/>

    <root level="INFO">
        <appender-ref ref="LOGSTASH" />
        <!-- 控制台输出 -->
        <appender-ref ref="STDOUT" />
        <!-- 文件输出 -->
        <appender-ref ref="ERROR" />
        <appender-ref ref="INFO" />
        <appender-ref ref="WARN" />
        <appender-ref ref="DEBUG" />
        <appender-ref ref="TRACE" />
    </root>

</configuration>
使用Kibana查看日志
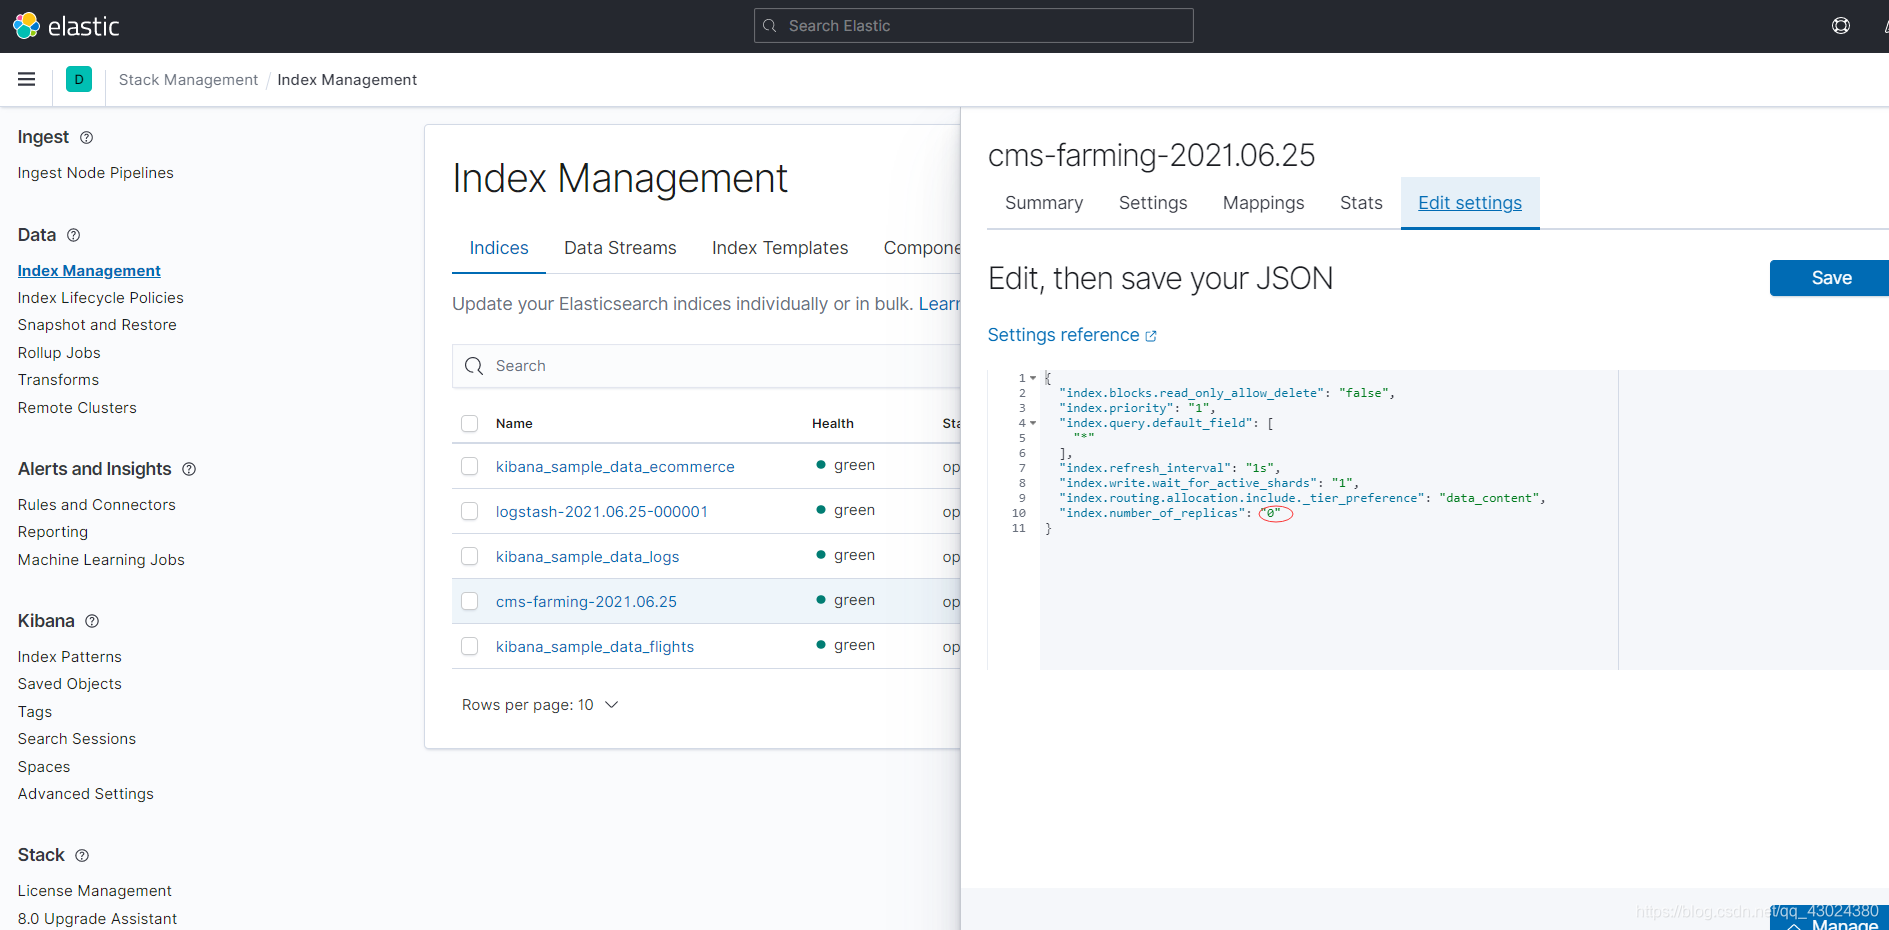
- 由于ES只有一个节点且ES创建的索引默认有一个主分片,一个副本分片,所以,索引健康状态为yellow。设置副本分片为0个后,索引健康状态为green.
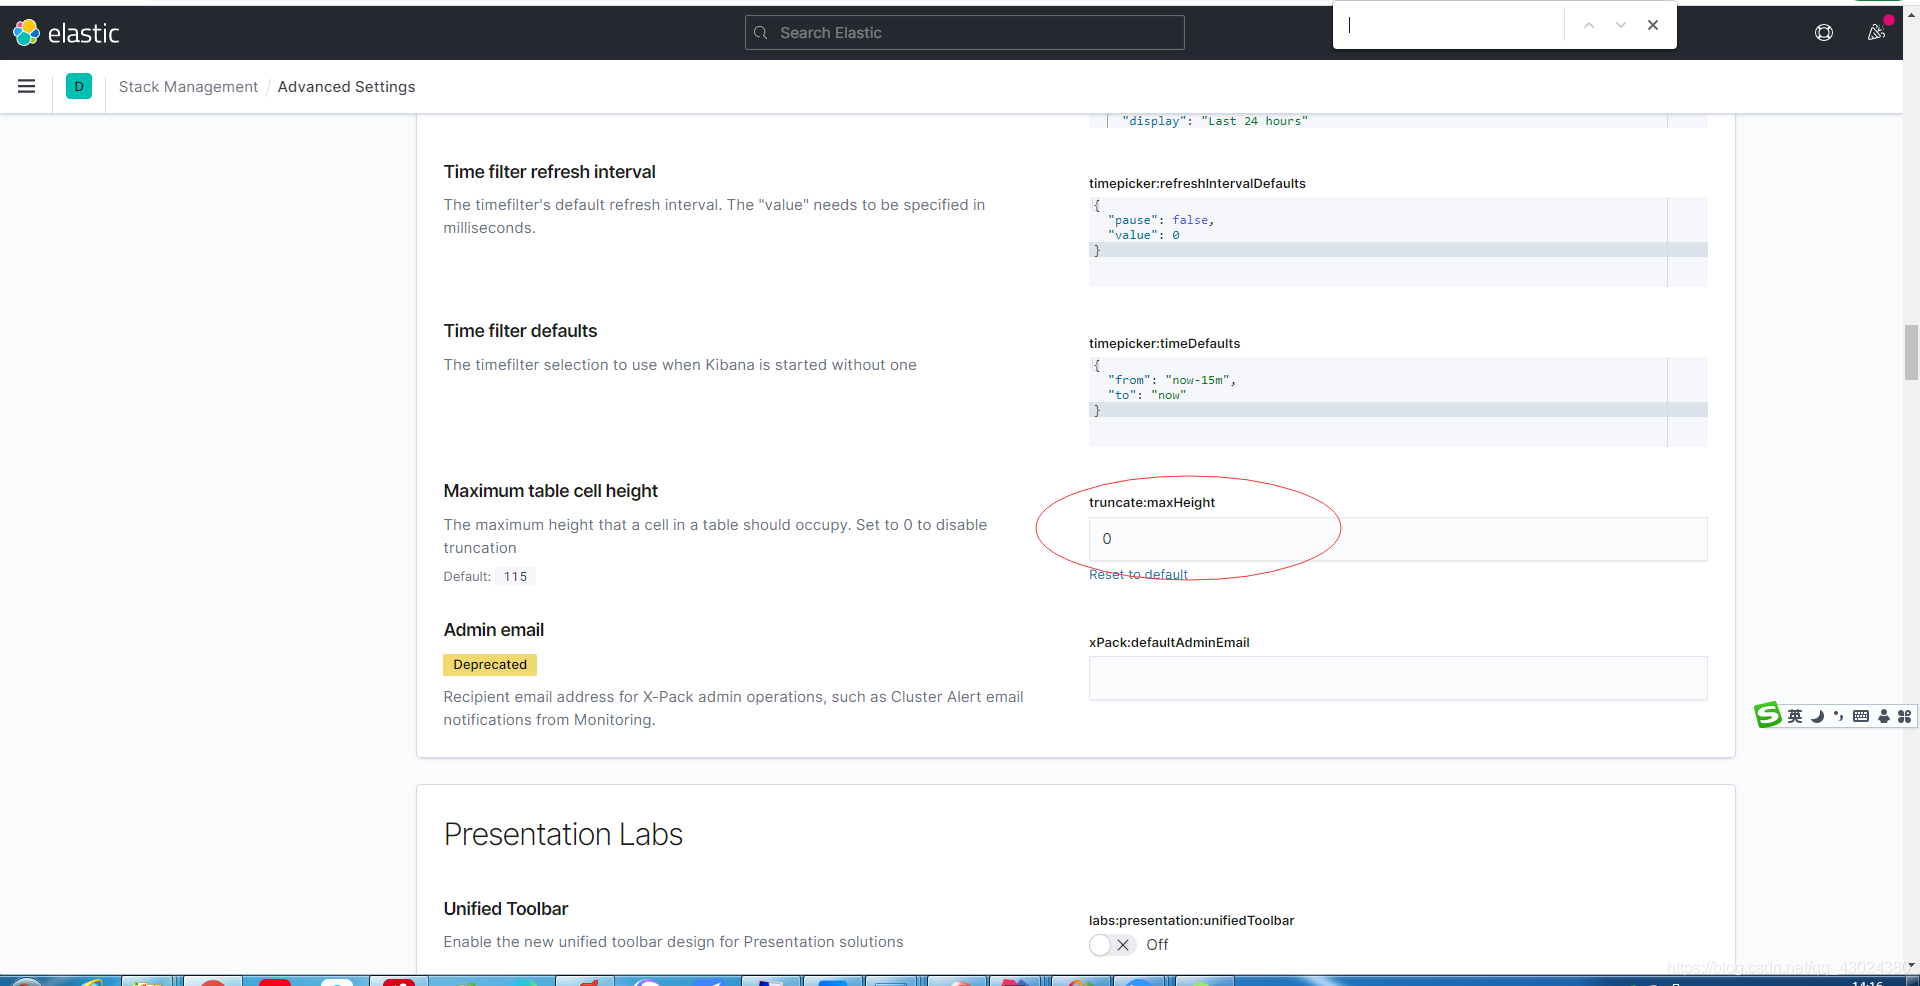
2.在Kibana的Discover看到的日志是被截断的,如果需要查看完整日志,可以在kibana的management=>advance setting里设置truncate:maxHeight为0


 6515
6515


 被折叠的 条评论
为什么被折叠?
被折叠的 条评论
为什么被折叠?
 到【灌水乐园】发言


