


 该博客通过Python的数据分析,展示了如何利用pandas库读取Excel数据,并使用matplotlib绘制饼图和条形图来展示不同菜品在某段时间内的销售量分布情况。饼图直观地显示了各菜品的销售比例,而条形图则按销量大小排列了各菜品。这种方法有助于理解菜品销售的热门趋势。
定性数据
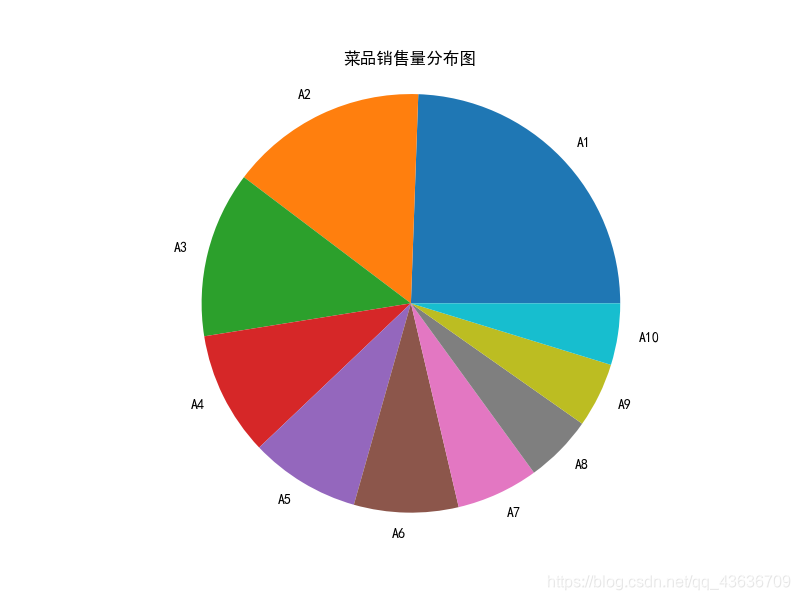
对于定性数据,根据变量的类型来分组,绘制饼状图或条形图来描述定性数据的分布
不同菜品在某段时间的销售量分布情况
import pandas as pd
import matplotlib.pyplot as plt
plt.rcParams['font.sans-serif'] = 'SimHei'
data = pd.read_excel("catering_dish_profit.xls")
#饼图
x = data['盈利']
labels = data['菜品名']
plt.figure(figsize=(8,6))
plt.pie(x,labels = labels)
plt.title("菜品销售量分布图")
plt.axis('equal')
plt.show()
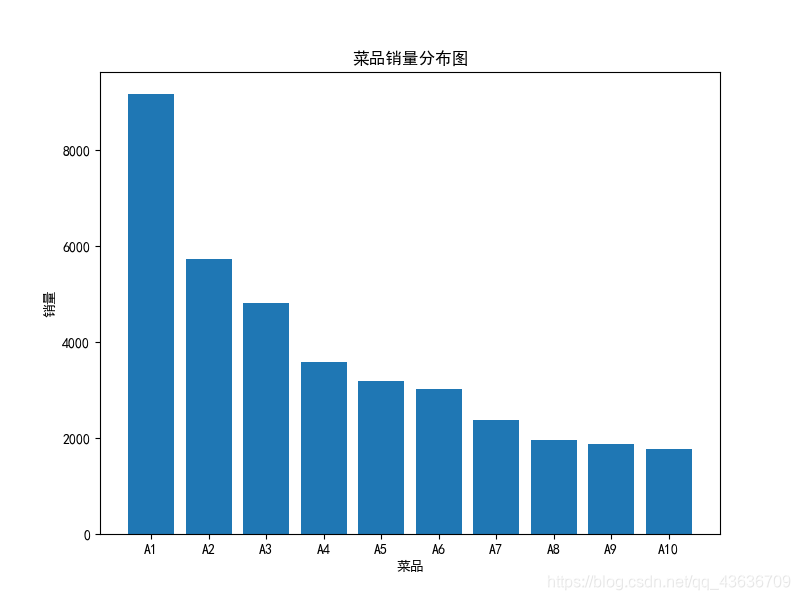
#条形图
x = data['菜品名']
y = data['盈利']
plt.figure(figsize=(8,6))
plt.bar(x,y)
plt.xlabel('菜品')
plt.ylabel('销量')
plt.title('菜品销量分布图')
plt.show()


 1266
1266

 被折叠的 条评论
为什么被折叠?
被折叠的 条评论
为什么被折叠?
 到【灌水乐园】发言


