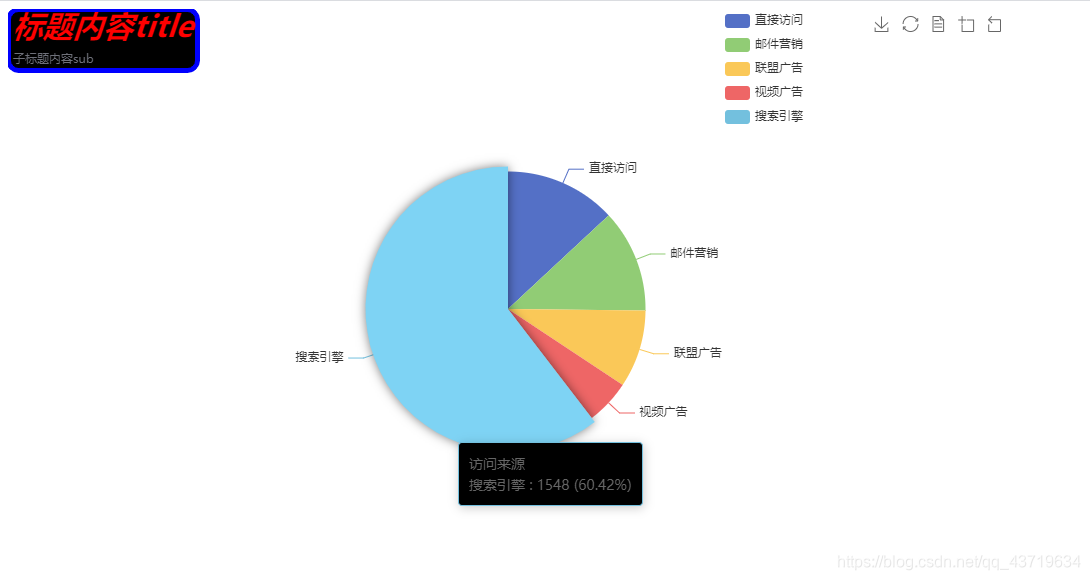
1.基础饼图
<!DOCTYPE html>
<html>
	<head>
		<meta charset="utf-8">
		<title></title>
	</head>
	<body>

		<div id="bar" style="width: 1000px;height: 500px;">

		</div>

		<script src="../js/echarts.min.js"></script>
		<script type="text/javascript">
			var mycharts = echarts.init(document.getElementById('bar'));
			option = {
			    title:{
			    	show : "true",   //是否显示标题
			    	text:"标题内容title",   //主标题的内容
			    	textStyle:{ 			//主标题字体样式
			    		color:"red",		//字体颜色
			    		fontStyle:"italic"	,	//字体样式  'normal' 'italic' 'oblique'
			    		fontWeight:	"bold",			//主标题文字字体的粗细。'normal''bold''bolder''lighter'数值
			    		//fontFamily:					//主标题文字的字体系列
			    		fontSize:30						//主标题文字的字体大小。
			    	},
			    	subtext:"子标题内容sub",
			    	subtextStyle:{
			    		//与主标题样式设置一致
			    	},
			    	left:"left",						//title 组件离容器左侧的距离。'left', 'center', 'right' 数值px
			    	//right:"",							//title 组件离容器右侧的距离。
			    	top:"top",								//title 组件离容器上侧的距离。
			    	//bottom:								//title 组件离容器下侧的距离。
			    	backgroundColor:"black",				//title组件背景颜色
			    	borderColor:"blue",							//title组件边框颜色
			    	borderWidth:5,							//title组件边框宽度
			    	borderRadius:10							//	title组件边框圆角
			    },

			    legend:{        //图例配置
			    	show:true,
			    	//left:""
			    	right:200,
			    	top:"top",
			    	//bottom:
			    	orient:"vertical",   //图例显示方向  垂直或水平
			         data: ['直接访问', '邮件营销', '联盟广告', '视频广告', '搜索引擎']
			    },
			    grid:{      //网格大小配置

			    	//网格大小配置
			    	left:'10%',
			    	right:100,
			    	top:'20%',
			    	bottom:100,
			    },
			    tooltip:{    //提示框
			    	show:true,
			    	trigger:"item",   //触发方式  item  ,axis坐标轴
			    	backgroundColor:"#000000", //提示框背景颜色
			    	textStyle:{ 		//提示字体样式配置
			    		//配置类似主标题字体配置

			    	},

					formatter: '{a} <br/>{b} : {c} ({d}%)'  //自定义提示内容

			    },
			    toolbox:{    //工具箱设置
			    	show:true,
			    	orient:"horizontal",    //工具箱显示方向  垂直或者水平
			    	itemSize:15,			//工具箱图标icon大小
			    	itemGap:10,			//	icon间隔大小
			    	showTitle:true,			//显示icon标题
			    	feature:{				//工具箱所含功能设置
			    		saveAsImage:{		//保存为图片
			    			show:true
			    		},
			    		restore:{			//配置项还原
			    			show:true
			    		},
			    		dataView:{			//数据视图
			    			show:true,
			    			 readOnly:true,  //只读
			    		},
			    		 magicType:{ 			//动态类型切换

			    		},
			    		 dataZoom:{			//数据区域缩放

			    		 }
			    	}
			    },
			   series: [
			           {
			               name: '访问来源',
			               type: 'pie',
			               radius: '55%',      //半径大小
			               center: ['50%', '60%'],     //位置设置
			               data: [
			                   {value: 335, name: '直接访问'},
			                   {value: 310, name: '邮件营销'},
			                   {value: 234, name: '联盟广告'},
			                   {value: 135, name: '视频广告'},
			                   {value: 1548, name: '搜索引擎'}
			               ],
						   label:{
							   show:true    ,//是否显示标签
							   //标签字体设置
							   //color:"",
							   //fontStyle:
							  // fontWeight:
							  // fontFamily:
							  // fontSize:
						   },
			               emphasis: {  		//高亮的扇区和标签样式。
								label:{			//高亮时饼图的标签
									show:true
								},
								labelLine:{		//高亮时饼图每块标签线设置

								},
			                   itemStyle: {
			                       shadowBlur: 10,    //图形阴影的模糊大小。
			                       shadowOffsetX: 0, 	//阴影水平方向上的偏移距离。
			                       shadowColor: 'rgba(0, 0, 0, 0.5)'   //阴影颜色
			                   }
			               }
			           }
			       ]

			};

			mycharts.setOption(option);
		</script>
	</body>
</html>
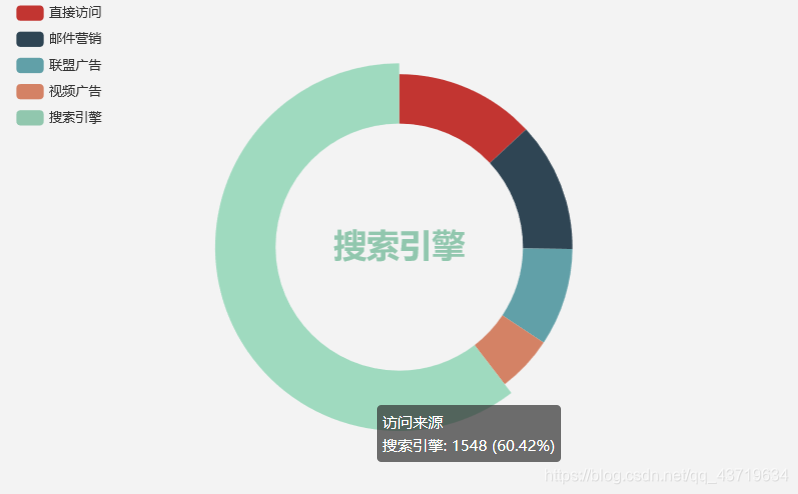
2.环形图
<!DOCTYPE html>
<html>
	<head>
		<meta charset="utf-8">
		<title></title>
	</head>
	<body>

		<div id="bar" style="width: 1000px;height: 500px;">

		</div>

		<script src="../js/echarts.min.js"></script>
		<script type="text/javascript">
			var mycharts = echarts.init(document.getElementById('bar'));
			option = {
			    tooltip: {
			        trigger: 'item',
			        formatter: '{a} <br/>{b}: {c} ({d}%)'
			    },
			    legend: {
			        orient: 'vertical',
			        left: 10,
			        data: ['直接访问', '邮件营销', '联盟广告', '视频广告', '搜索引擎']
			    },
			    series: [
			        {
			            name: '访问来源',
			            type: 'pie',
			            radius: ['50%', '70%'],   //内外半径
			            avoidLabelOverlap: false,     //避免标签被遮挡
			            label: {
			                show: false,
			                position: 'center'
			            },
			            emphasis: {
			                label: {
			                    show: true,
			                    fontSize: '30',
			                    fontWeight: 'bold'
			                }
			            },
			            labelLine: {
			                show: false
			            },
			            data: [
			                {value: 335, name: '直接访问'},
			                {value: 310, name: '邮件营销'},
			                {value: 234, name: '联盟广告'},
			                {value: 135, name: '视频广告'},
			                {value: 1548, name: '搜索引擎'}
			            ]
			        }
			    ]
			};
			    title:{
			    	show : "true",   //是否显示标题
			    	text:"标题内容title",   //主标题的内容
			    	textStyle:{ 			//主标题字体样式
			    		color:"red",		//字体颜色
			    		fontStyle:"italic"	,	//字体样式  'normal' 'italic' 'oblique'
			    		fontWeight:	"bold",			//主标题文字字体的粗细。'normal''bold''bolder''lighter'数值
			    		//fontFamily:					//主标题文字的字体系列
			    		fontSize:30						//主标题文字的字体大小。
			    	},
			    	subtext:"子标题内容sub",
			    	subtextStyle:{
			    		//与主标题样式设置一致
			    	},
			    	left:"left",						//title 组件离容器左侧的距离。'left', 'center', 'right' 数值px
			    	//right:"",							//title 组件离容器右侧的距离。
			    	top:"top",								//title 组件离容器上侧的距离。
			    	//bottom:								//title 组件离容器下侧的距离。
			    	backgroundColor:"black",				//title组件背景颜色
			    	borderColor:"blue",							//title组件边框颜色
			    	borderWidth:5,							//title组件边框宽度
			    	borderRadius:10							//	title组件边框圆角
			    },

			    legend:{        //图例配置
			    	show:true,
			    	//left:""
			    	right:200,
			    	top:"top",
			    	//bottom:
			    	orient:"horizontal",   //图例显示方向  垂直或水平
			        data: ['邮件营销', '联盟广告', '视频广告', '直接访问', '搜索引擎']
			    },
			    grid:{      //网格大小配置

			    	//网格大小配置
			    	left:'10%',
			    	right:100,
			    	top:'20%',
			    	bottom:100,
			    },
			    tooltip:{    //提示框
			    	show:true,
			    	trigger:"axis",   //触发方式  item  ,axis坐标轴
			    	backgroundColor:"#000000", //提示框背景颜色
			    	textStyle:{ 		//提示字体样式配置
			    		//配置类似主标题字体配置

			    	}

			    },
			    toolbox:{    //工具箱设置
			    	show:true,
			    	orient:"horizontal",    //工具箱显示方向  垂直或者水平
			    	itemSize:15,			//工具箱图标icon大小
			    	itemGap:10,			//	icon间隔大小
			    	showTitle:true,			//显示icon标题
			    	feature:{				//工具箱所含功能设置
			    		saveAsImage:{		//保存为图片
			    			show:true
			    		},
			    		restore:{			//配置项还原
			    			show:true
			    		},
			    		dataView:{			//数据视图
			    			show:true,
			    			 readOnly:true,  //只读
			    		},
			    		 magicType:{ 			//动态类型切换

			    		},
			    		 dataZoom:{			//数据区域缩放

			    		 }
			    	}
			    },


			};

			mycharts.setOption(option);
		</script>
	</body>
</html>
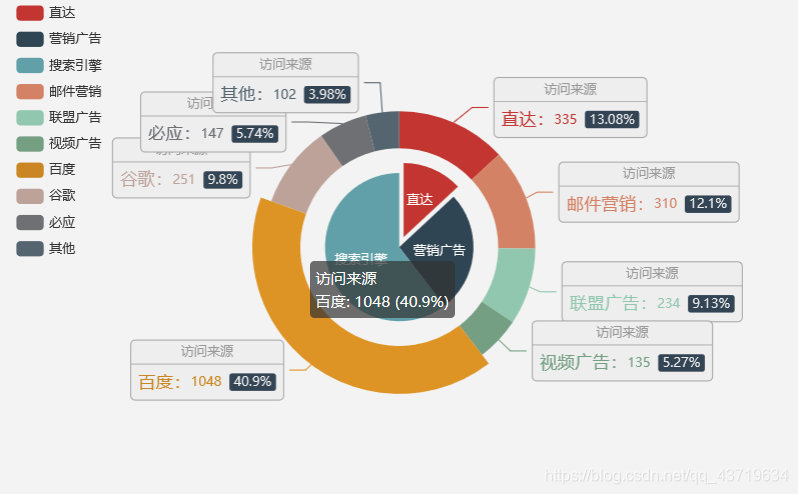
3.组合图
option = {
    tooltip: {
        trigger: 'item',
        formatter: '{a} <br/>{b}: {c} ({d}%)'
    },
    legend: {
        orient: 'vertical',
        left: 10,
        data: ['直达', '营销广告', '搜索引擎', '邮件营销', '联盟广告', '视频广告', '百度', '谷歌', '必应', '其他']
    },
    series: [
        {
            name: '访问来源',
            type: 'pie',
            selectedMode: 'single',
            radius: [0, '30%'],

            label: {
                position: 'inner'
            },
            labelLine: {
                show: false
            },
            data: [
                {value: 335, name: '直达', selected: true},
                {value: 679, name: '营销广告'},
                {value: 1548, name: '搜索引擎'}
            ]
        },
        {
            name: '访问来源',
            type: 'pie',
            radius: ['40%', '55%'],
            label: {
                formatter: '{a|{a}}{abg|}\n{hr|}\n  {b|{b}:}{c}  {per|{d}%}  ',
                backgroundColor: '#eee',
                borderColor: '#aaa',
                borderWidth: 1,
                borderRadius: 4,
                // shadowBlur:3,
                // shadowOffsetX: 2,
                // shadowOffsetY: 2,
                // shadowColor: '#999',
                // padding: [0, 7],
                rich: {
                    a: {
                        color: '#999',
                        lineHeight: 22,
                        align: 'center'
                    },
                    // abg: {
                    //     backgroundColor: '#333',
                    //     width: '100%',
                    //     align: 'right',
                    //     height: 22,
                    //     borderRadius: [4, 4, 0, 0]
                    // },
                    hr: {
                        borderColor: '#aaa',
                        width: '100%',
                        borderWidth: 0.5,
                        height: 0
                    },
                    b: {
                        fontSize: 16,
                        lineHeight: 33
                    },
                    per: {
                        color: '#eee',
                        backgroundColor: '#334455',
                        padding: [2, 4],
                        borderRadius: 2
                    }
                }
            },
            data: [
                {value: 335, name: '直达'},
                {value: 310, name: '邮件营销'},
                {value: 234, name: '联盟广告'},
                {value: 135, name: '视频广告'},
                {value: 1048, name: '百度'},
                {value: 251, name: '谷歌'},
                {value: 147, name: '必应'},
                {value: 102, name: '其他'}
            ]
        }
    ]
};


 1159
1159

 被折叠的 条评论
为什么被折叠?
被折叠的 条评论
为什么被折叠?
 到【灌水乐园】发言


