


实现的效果如下:
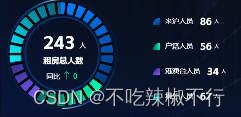
这个图表就是在渐变环形图的基础上进行构造的,同样的我的data的结构同渐变圆环图的一样
由于ui图的设计中的图例在基本的结构中没有,在echarts中定义了一些图例的形状
icon:
circle, rect, roundRect, triangle, diamond, pin, arrow, none
或者使用图片链接 image://或者base64图片(可在网上在线转成base64类型)
我这里是使用的阿里巴巴矢量图库iconfont的图标,选择自己需要的图标加入购物车然后添加到项目中,到这个页面中,点击到symbol点击生成代码,下边会出现一个js文件的链接
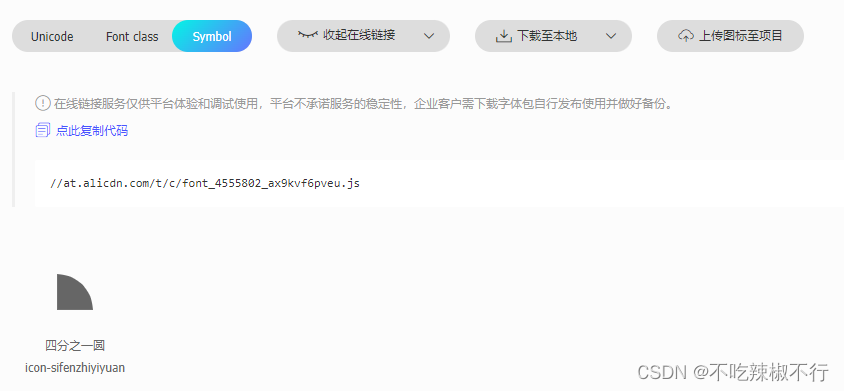
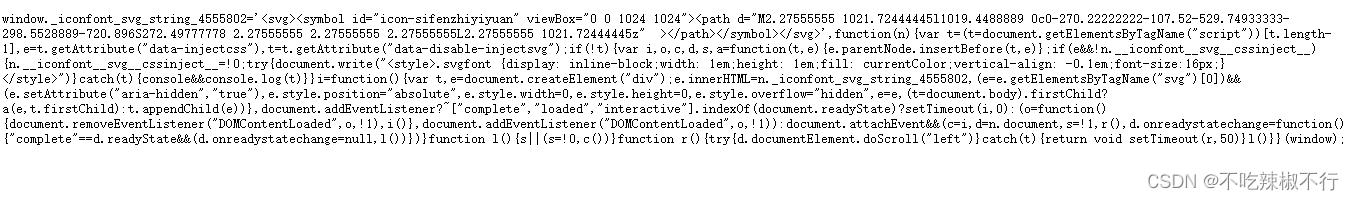 在这个文件中我们只需要path d =“”里的内容放在echarts中legend中的icon中icon: 'path://',中即可自定义legend的图标。
具体的代码如下
<div class="chart" ref="chartRef" style="width: 400px; height: 230px;"></div><script setup>
import * as echarts from 'echarts';
import { ref, onMounted, nextTick } from 'vue';
const chartRef = ref(null)
import up from '../../assets/images/cockpit/right/icon-arrow-up.png'
import down from '../../assets/images/cockpit/right/icon-arrow-down.png'
const obj= {}//同渐变圆环图的结构,就不展示了
const totalValue = ref(obj.equmentStatusEchart.reduce((total, value) => total + value.value, 0));
const rangArr = ref([]);
let cacheNum = 0;
for (let i = 0; i < obj.equmentStatusEchart.length; i++) {
const endNum = cacheNum + obj.equmentStatusEchart[i].value;
rangArr.value.push([cacheNum, endNum]);
cacheNum = endNum;
}
const angleArr = ref(rangArr.value.map(arr => arr.map(num => (num / totalValue.value) * Math.PI * 2)));
function getCoordinates(startArc, endArc) {
const posi = [
Math.sin(startArc),
-Math.cos(startArc),
Math.sin(endArc),
-Math.cos(endArc)
];
const dx = posi[2] - posi[0];
const dy = posi[3] - posi[1];
return getLocation(dx, dy);
}
function getLocation(dx, dy) {
const tanV = dx / dy;
const directSign = Math.abs(tanV) < 1;
const t = directSign ? tanV : 1 / tanV;
const sign1 = t > 0 ? 1 : -1;
const sign2 = dx > 0 ? 1 : -1;
const sign = directSign ? sign1 * sign2 : sign2;
const group1 = [0.5 - sign * t / 2, 0.5 + sign * t / 2];
const group2 = sign > 0 ? [0, 1] : [1, 0];
const group = [...group1, ...group2];
const keys = directSign ? ['x', 'x2', 'y', 'y2'] : ['y', 'y2', 'x', 'x2'];
let res = {};
keys.forEach((k, idx) => {
res[k] = group[idx];
});
return res;
}
onMounted(() => {
const chartDom = chartRef.value;
const myChart = echarts.init(chartDom);
myChart.setOption({
tooltip: {
trigger: 'item',
backgroundColor: 'rgba(0, 0 , 0, .6)',
borderColor: "rgba(147, 235, 248, .8)",
textStyle: {
color: "#fff"
},
},
graphic: [
{
type: 'text',
left: '18%',
top: '30%',
style: {
text: totalValue.value,
fill: '#fff',
fontSize: 36,
fontWeight: 600,
fontFamily: 'ShuHeiTi'
}
},
{
type: 'text',
left: '36%',
top: '38%',
style: {
text: '人',
fill: '#fff',
fontSize: 14,
fontWeight: 400,
}
},
{
type: 'text',
left: '18%',
top: '50%',
style: {
text: '租房总人数',
fill: '#fff',
fontSize: 16,
fontWeight: 400,
fontFamily: 'ShuHeiTi'
}
},
{
type: 'text',
left: '20%',
top: '65%',
style: {
text: '同比',
fill: '#fff',
fontSize: 14,
fontWeight: 400,
}
},
{
type: 'image',
left: '30%',
top: '63%',
style: {
image: '/src/assets/images/cockpit/right/icon-arrow-up.png',
width:10,
height:16,
}
},
{
type: 'text',
left: '34%',
top: '65%',
style: {
text: '0',
fill: '#00FFB1',
fontSize: 14,
fontWeight: 400,
}
},
],
legend: {
// data: obj.equmentStatusEchart,
orient: 'vertical',
right: 10,
top: 0,
icon: 'path://M 1021.72 1021.72 l 0 -1019.45 c -270.222 0 -529.749 107.52 -720.896 298.553 S 2.27556 751.502 2.27556 1021.72 L 1021.72 1021.72 Z',
formatter: function(name) {
const item = obj.equmentStatusEchart.find(item => item.name === name);
let text = '{a|' + item.name + '}' + ' {b|' + item.value + '}' + ' {c|' + '人' + '} \n';
if(item.up) {
text += '{d|' + '同比' + '}' + '{e|}' + '{f|' + item.up + '}';
} else if(item.down) {
text += '{d|' + '同比' + '}' + '{h|}' + '{g|' + item.down + '}';
}
return text
},
textStyle: {
rich: {
a: {
color: '#fff',
fontSize: 14,
fontWeight: 400,
padding: [15, 0, 0, 0]
},
b: {
color: '#fff',
fontSize: 20,
fontWeight: 600,
fontFamily: 'ShuHeiTi',
padding: [15, 0, 0, 10]
},
c: {
color: '#fff',
fontSize: 10,
fontWeight: 400,
lineHeight: 30,
padding: [14, 0, 0, 0]
},
d: {
color: '#fff',
fontSize: 12,
fontWeight: 400,
padding: [0, 10, 0, 60]
},
e: {
width:10,
height: 16,
backgroundColor: {image: up}
},
h: {
width:10,
height: 16,
backgroundColor: {image: down}
},
f: {
color: '#00FFB1',
fontSize: 14,
fontWeight: 400,
lineHeight: 20,
padding: [0, 0, 0, 5]
},
g: {
color: '#F00000',
fontSize: 14,
fontWeight: 400,
lineHeight: 20,
padding: [0, 0, 0, 5]
}
}
},
},
series: [
{//最外部细虚线
type: 'gauge',
startAngle: 0,
endAngle: 360,
radius: '110%',
center: ['28%', '52%'],
axisTick: {
show: false
},
axisLabel: {
show: false
},
splitNumber: 30,
axisLine: {
show: false,
},
splitLine: {
length: 25,
lineStyle: {
width: 5,
color: 'rgba(8, 21, 53, 1)',
distance: 10,
} //刻度节点线
},
detail: {
show: false
},
z:10
},
{
type: 'pie',
radius: ['75%', '89%'],
center: ['28%', '52%'],
avoidLabelOverlap: false,
itemStyle: {
},
label: {
show: false,
position: 'outer',
align: 'left',
height: 50,
lineHeight: 10,
formatter: function(params) {
return (
'{a|' + params.data.name + '}\n' +
'{b|' + params.data.value + ' } ' +
'{value| 人}'
);
},
borderWidth: 10,
padding: [0, -60],
rich: {
a: {
fontSize: 14,
color: '#fff',
fontWeight: 400,
lineHeight: 35
},
b: {
color: '#fff',
fontSize: 18,
fontWeight: 600,
lineHeight: 10
},
value: {
color: '#fff',
fontSize: 14,
fontWeight: 400,
}
}
},
labelLine: {
show: false
},
emphasis: {
itemStyle:{
shadowBlur: 10,
shadowOffsetX: 0,
shadowColor: 'rgba(0, 0, 0, 0.2)'
}
},
z: 1,
itemStyle: {
},
data: obj.equmentStatusEchart.map((item, index) => {
const range = getCoordinates(angleArr.value[index][0], angleArr.value[index][1]);
const startColor = `rgb(${Math.floor(Math.random() * 256)}, ${Math.floor(Math.random() * 256)}, ${Math.floor(Math.random() * 256)})`;
const color = {
type: 'linear',
x: range.x,
x2: range.x2,
y: range.y,
y2: range.y2,
colorStops: [{
offset: 0, color: item.start // 指定起始颜色
}, {
offset: 1, color: item.end // 指定终点颜色
}],
global: false
};
return {
name: item.name,
value: item.value,
itemStyle: {
color: color
}
};
})
}
],
});
})
</script>


 1316
1316


 被折叠的 条评论
为什么被折叠?
被折叠的 条评论
为什么被折叠?
 到【灌水乐园】发言


