


前一篇用的是launch,这一篇更改为attach。
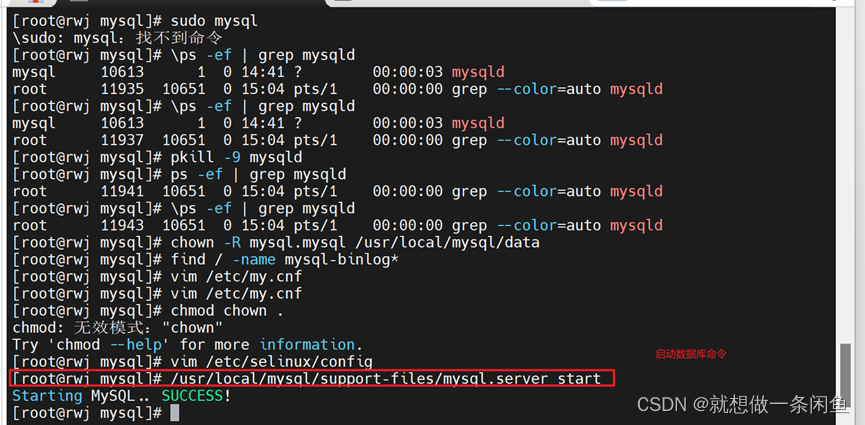
1.启动数据库
/usr/local/mysql/support-files/mysql.server start
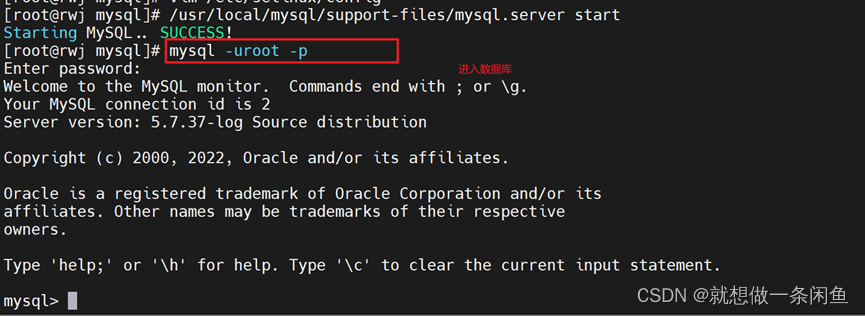
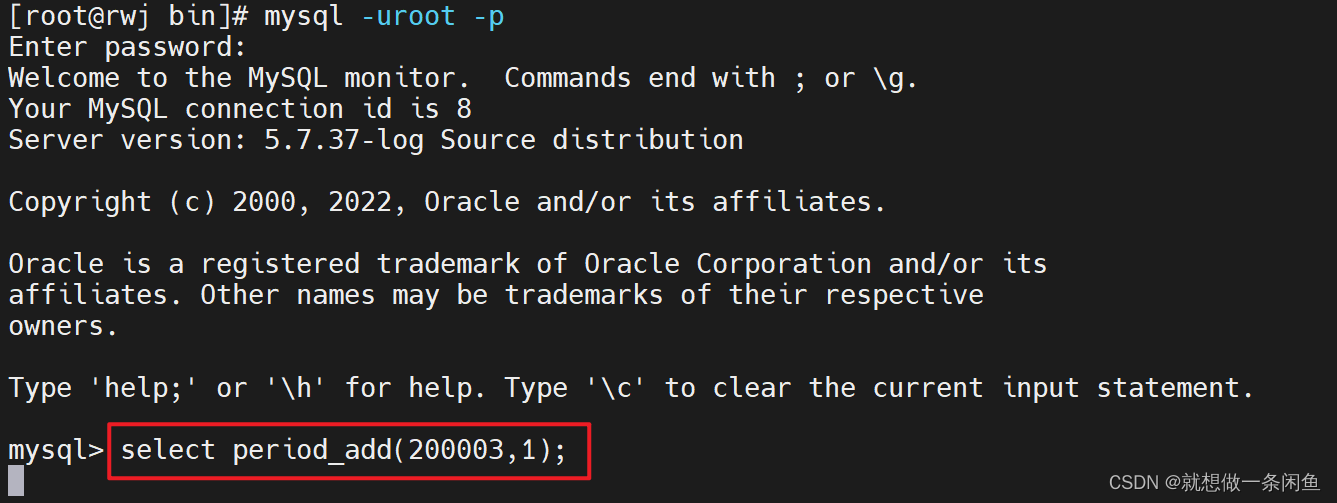
2.进入数据库
mysql -uroot -p
我在/etc/my.cnf 加了skip-grant tables
免密登录(问也是空密码)
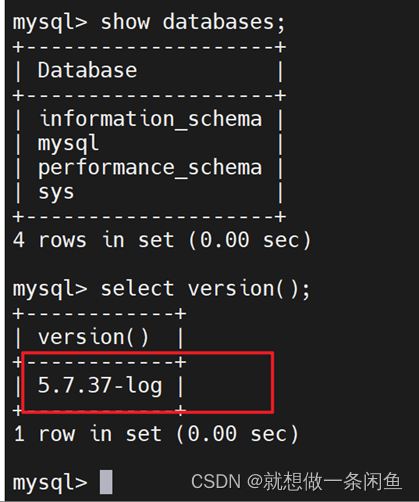
顺便查了一下版本
3.改了配置文件
{
    // Use IntelliSense to learn about possible attributes.
    // Hover to view descriptions of existing attributes.
    // For more information, visit: https://go.microsoft.com/fwlink/?linkid=830387
    "version": "0.2.0",
    "configurations": [
        {
            "name": "openGauss-debug",
            "type": "cppdbg",
            "request": "attach",
            "program": "/usr/local/mysql/bin/mysqld",
            "args": ["--user=mysql --datadir=/usr/local/mysql/data"],
            "processId": "${command:pickProcess}",
            "MIMode": "gdb",
            "setupCommands": [
                {
                    "description": "Enable pretty-printing for gdb",
                    "text": "-enable-pretty-printing",
                    "ignoreFailures": true
                },
                {
                    "description":  "Set Disassembly Flavor to Intel",
                    "text": "-gdb-set disassembly-flavor intel",
                    "ignoreFailures": true
                }
            ]
        }
    ]
}
原来版本
{
    "version": "0.2.0",
    "configurations": [
        {
            "name": "MySQL-debug",
            "type": "cppdbg",
            "request": "launch",
            "program": "/usr/local/mysql/bin/mysqld",
            "args": ["--user=mysql --datadir=/usr/local/mysql/data"],
            "stopAtEntry": true,
            "environment": [],
            "externalConsole": false,
            "MIMode": "gdb",
            "miDebuggerPath": "gdb",
            "miDebuggerArgs": "gdb",
            "linux": {
                "MIMode": "gdb",
                "miDebuggerPath": "/usr/bin/gdb"
            },
            "logging": {
                "moduleLoad": false,
                "engineLogging": false,
                "trace": false
            },
            "setupCommands": [
                {
                    "description": "Enable pretty-printing for gdb",
                    "text": "-enable-pretty-printing",
                    "ignoreFailures": true
                }
            ],
            "cwd": "${workspaceFolder}",
        }
    ]
}
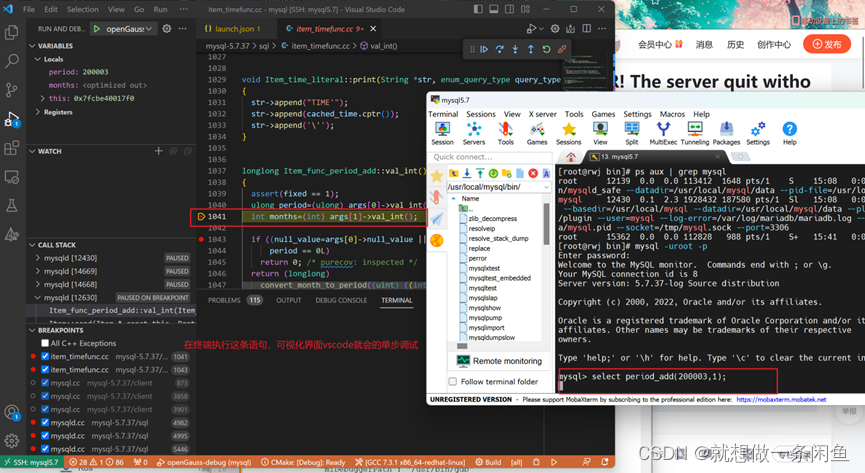
4.调试
以时间函数Item_time_literal()为例:
先打好断点,我打在了1041行,通过命令查看进程号
ps aux | grep mysql
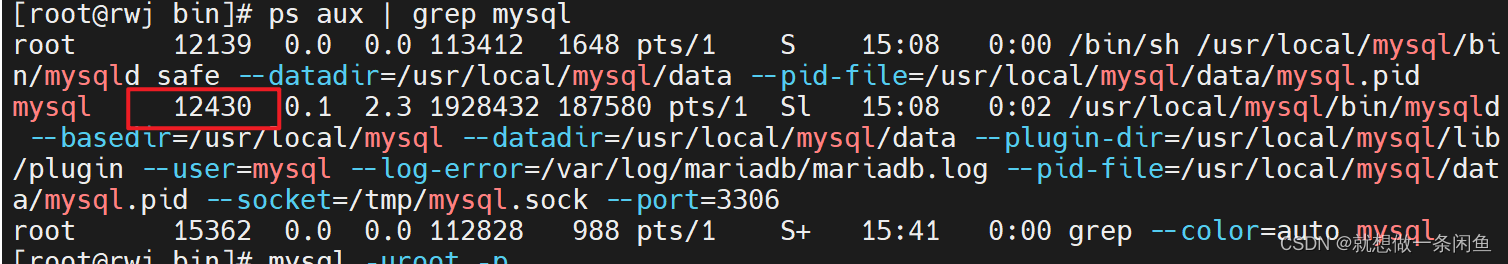

打好断点就run->start debugging
选择attach 12430
- 终端进入数据库输入查询语句敲enter
与此同时,vscode图形化界面就会开始调试!


 426
426


 被折叠的 条评论
为什么被折叠?
被折叠的 条评论
为什么被折叠?
 到【灌水乐园】发言


