


目录
创建项目
见:使用Vite+Vue3的简单项目搭建
项目运行:
npm run dev
router
处于项目根目录下
执行命令
npm install vue-router@4

这时能看到配置文件package.json中出现以下框选内容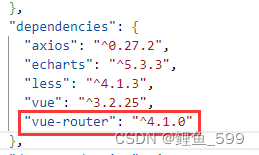
新建文件
1、找到项目的main.js文件添加以下代码
// 引入路由
import router from './router'
整个文件代码为
import { createApp } from 'vue'
import App from './App.vue'
// 引入路由
import router from './router'
import ElementPlus from 'element-plus'
import 'element-plus/theme-chalk/index.css'

createApp(App).use(router).use(ElementPlus).mount('#app')
其中element-plus是另外载入的
2、在项目目录src下新建文件夹router
3、在router文件夹下新建js文件index.js

4、在router/index.js文件中写入以下内容
import { createRouter, createWebHistory } from 'vue-router'
// 开启历史模式
// vue2中使用的mode:history 实现
const routes = [
  {
    path: '/',
    redirect: '/home' // 重定向到home页面
  },
  {
    path: '/home',
    component: () => import('../views/HelloWorld.vue') // 在src文件夹下新建的views文件夹,用于存放各个页面
  },
  {
    path: '/about',
    component: () => import('../views/AdoutView.vue')
  }
]
const router = createRouter(
  {
    history: createWebHistory(),
    routes
  }
)

export default router
其中../views/AdoutView.vue两个页面是自己新建的,在src下新建views文件夹,在views文件夹下新建两个名为AdoutView和HelloWorld的.vue页面
5、App.vue
<template>
  <div class="app">
    <router-link to="/home">Home</router-link> |
    <router-link to="/about">About</router-link>
    <p></p>
    <img alt="Vue logo" src="./assets/logo.png" />
    <router-view></router-view>
  </div>
</template>

<script>

</script>

<style>
#app {
  font-family: Avenir, Helvetica, Arial, sans-serif;
  -webkit-font-smoothing: antialiased;
  -moz-osx-font-smoothing: grayscale;
  text-align: center;
  color: #2c3e50;
  margin-top: 60px;
  font-size: 23px;
}
</style>
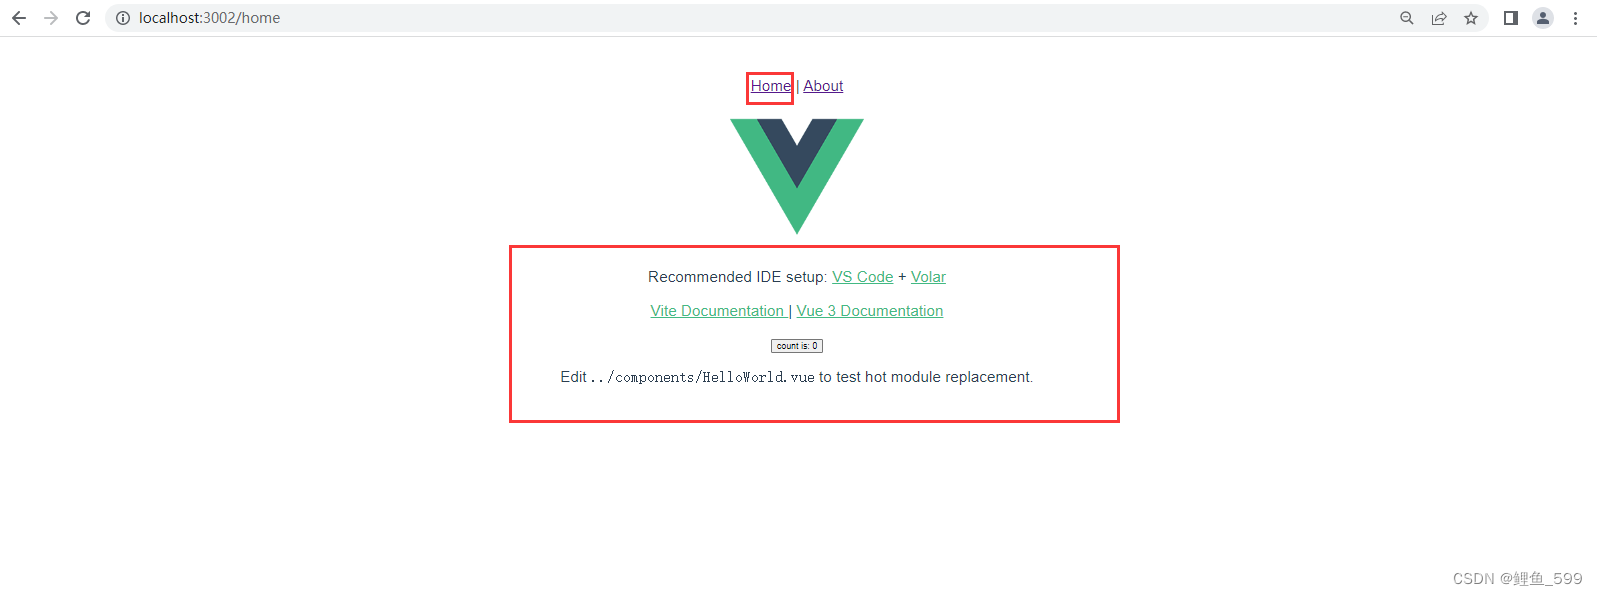
6、页面内容
HelloWorld.vue
<script setup>
import { ref } from 'vue'

defineProps({
  msg: String
})

const count = ref(0)
</script>

<template>
  <div>
    <h1>{{ msg }}</h1>

    <p>
      Recommended IDE setup:
      <a href="https://code.visualstudio.com/" target="_blank">VS Code</a>
      +
      <a href="https://github.com/johnsoncodehk/volar" target="_blank">Volar</a>
    </p>

    <p>
      <a href="https://vitejs.dev/guide/features.html" target="_blank">
        Vite Documentation
      </a>
      |
      <a href="https://v3.vuejs.org/" target="_blank">Vue 3 Documentation</a>
    </p>

    <button type="button" @click="count=count+12434415">count is: {{ count }}</button>
    <p>
      Edit
      <code>../components/HelloWorld.vue</code> to test hot module replacement.
    </p>
  </div>
</template>

<style scoped>
a {
  color: #42b983;
}
</style>
AdoutView.vue
<template>
  <div>
    <!-- 测试element-ui有没有导入成功 -->
    <!-- <el-button type=" primary" >按钮</el-button> -->
    <p>AdoutView页面</p>
  </div>
</template>
8、展示效果

ECharts
官网示例:官网示例
1、安装
npm install --save echarts
2、使用挂载
在需要使用的页面script中写入代码
import * as echarts from 'echarts'
就可使用echarts了
3、页面代码
替换AboutView.vue的代码,这里是重新写的代码,可以全选替换
<style scoped>
#sector {
  background-color: indigo;
  width: 50%;
  height: 320px;
  /* margin: 0 auto; */
}
</style>
<template>
  <div id="sector">
  </div>
</template>

<script>
import * as echarts from 'echarts'
export default {
  name: 'SectorName',
  data () {
    return {
      option: {
        animation: false,
        title: {
          text: '本周主煤流系统启动平均时长',
          textAlign: 'left',
          x: 'center',
          y: 'top',
          textStyle: {
            color: 'rgba(255, 255, 255, 0.8)',
            fontSize: 16
          }
        },
        color: ['#0d81f7', '#0fb42c'],
        tooltip: {},
        legend: {
          show: true,
          top: 18,
          right: 0,
          // 与series中的文字相同,只有一样的时候才会显示
          data: ['主煤流系统手动启动时长1', '主煤流智能启动时长'],
          textStyle: {
            color: 'rgba(255, 255, 255, 0.8)',
            fontSize: 13
          },
          itemWidth: 10,
          itemHeight: 10
        },
        xAxis: {
          axisTick: {
            show: false
          },
          axisLine: {
            lineStyle: {
              color: '#0092D5'
            }
          },
          axisLabel: {
            color: 'rgba(255, 255, 255, 0.8)'
          },
          // 横轴
          data: ['2020-01', '2020-02', '2020-03', '2020-04', '2020-05', '2020-06'],
          textStyle: {
            fontSize: 17
          }
        },
        yAxis: {
          name: '(分钟)',
          nameTextStyle: {
            color: 'rgba(255, 255, 255, 0.8)',
            align: 'right'
          },
          splitLine: {
            lineStyle: {
              type: 'dashed',
              color: '#0092D5',
              opacity: 0.3
            }
          },
          axisLine: {
            show: false
          },
          axisLabel: {
            color: 'rgba(255, 255, 255, 0.8)'
          }
        },
        grid: {
          top: '35%',
          bottom: '17%',
          left: '7%',
          right: '2%'
        },
        series: [{
          name: '主煤流系统手动启动时长1',
          barWidth: 40,
          type: 'bar',
          data: [110, 21, 3, 42, 15, 63],
          itemStyle: {
            normal: {
              label: {
                show: true, // 开启显示
                position: 'insideLeft', // 在上方显示
                offset: [-8, 0],
                textStyle: { // 数值样式
                  color: '#fff',
                  fontSize: 17
                }
              },
              color: new echarts.graphic.LinearGradient(0, 1, 0, 0, [{
                offset: 0,
                color: '#0069F5' // 0% 处的颜色
              }, {
                offset: 1,
                color: '#35C3FF' // 100% 处的颜色
              }], false)
            }
          }
        }, {
          name: '主煤流系统智能启动时长',
          barWidth: 40,
          type: 'bar',
          data: [92, 23, 74, 15, 11, 27],
          itemStyle: {
            normal: {
              label: {
                show: true, // 开启显示
                position: 'insideRight', // 在上方显示
                offset: [8, 0],
                textStyle: { // 数值样式
                  color: '#fff',
                  fontSize: 17
                }
              },
              color: new echarts.graphic.LinearGradient(0, 1, 0, 0, [{
                offset: 0,
                color: '#03AC32' // 0% 处的颜色
              }, {
                offset: 1,
                color: '#69EF00' // 100% 处的颜色
              }], false)
            }
          }
        }]
      }
    }
  },
  // 已完成模板已经渲染或el对应html渲染后
  // 在模板渲染成html后调用,通常是初始化页面完成后,再对html的dom节点进行一些需要的操作
  mounted () {
    // 取得div的ID对象
    const chart = echarts.init(document.getElementById('sector'))
    // 得到option的配置
    chart.setOption(this.option)
    // 建议加上以下这一行代码,不加的效果图如下(当浏览器窗口缩小的时候)。超过了div的界限(红色边框)
    window.addEventListener('resize', function () { chart.resize() })
  },
  methods: {},
  watch: {},
  created () {
  }
}
</script>
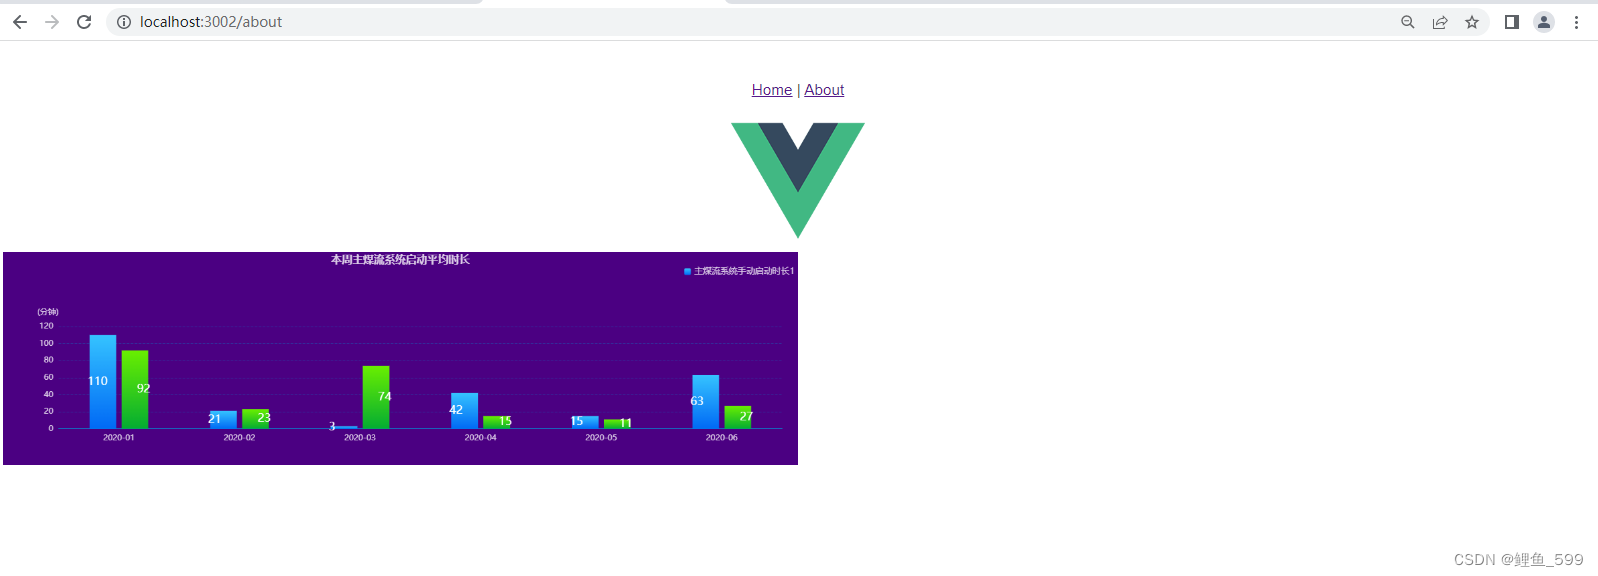
运行后长这样,这个代码也是网上找的,还有比较简单点的在Echarts的官网options中的内容替换即可
ESlint
安装
npm init @eslint/config
①选择模式:问要哪种的eslint,我选择的是最后一个检查错误,强制更改后才可以运行
? How would you like to use ESLint? ...
  To check syntax only
> To check syntax and find problems
  To check syntax, find problems, and enforce code style
②语言模块,选择javascript
? What type of modules does your project use? ...
> JavaScript modules (import/export)
  CommonJS (require/exports)
  None of these
③选择语言框架 选择vue.js
? Which framework does your project use? ...
  React
> Vue.js
  None of these
④是否使用ts,我这里的项目时没有使用TS的,所以我没选,看自己的项目来选择
? Does your project use TypeScript? » No / Yes
⑤代码在哪里运行 使用空格键全选 浏览器+node
? Where does your code run? ...  (Press <space> to select, <a> to toggle all, <i> to invert selection)
√ Browser
√ Node
⑥选择一个风格,这里选普遍用的流行风格就行
? How would you like to define a style for your project? ...
> Use a popular style guide
  Answer questions about your style
⑦你想遵循哪一种风格指南?选择Standard
? Which style guide do you want to follow? ...
  Airbnb: https://github.com/airbnb/javascript
> Standard: https://github.com/standard/standard
  Google: https://github.com/google/eslint-config-google
  XO: https://github.com/xojs/eslint-config-xo
⑧配置文件类型,选择JS
? What format do you want your config file to be in? ...
> JavaScript
  YAML
  JSON
⑨出现以下提示,选择Yes
Checking peerDependencies of eslint-config-standard@latest
Local ESLint installation not found.
The config that you've selected requires the following dependencies:

eslint-plugin-vue@latest eslint-config-standard@latest eslint@^8.0.1 eslint-plugin-import@^2.25.2 eslint-plugin-n@^15.0.0 eslint-plugin-promise@^6.0.0
? Would you like to install them now? » No / Yes
⑩选择安装方式,有啥用啥,我一般用npm(建议不使用pnpm)
? Which package manager do you want to use? ...
> npm
  yarn
  pnpm
然后就会在安装了,等待安装好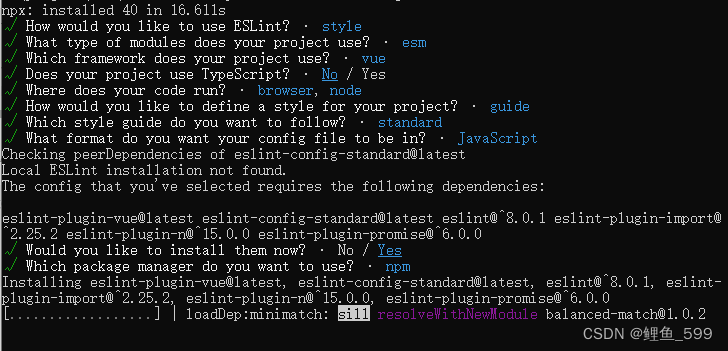
安装完成
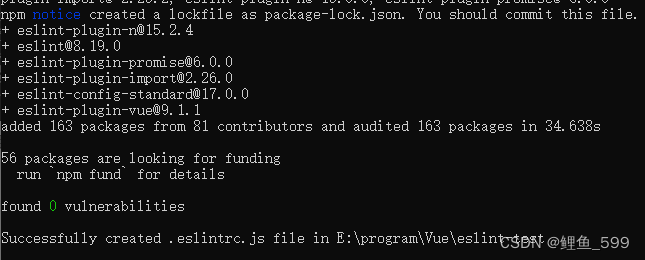
安装完成后,项目根目录会出现.eslintrc.js文件

继续安装
npm i -D vite-plugin-eslint
添加代码
在根目录的vite.config.js文件中添加以下代码
eslintPlugin({
      include: ['src/**/*.js', 'src/**/*.vue', 'src/*.js', 'src/*.vue']
    })
该文件全部代码如下
import { defineConfig } from 'vite'
import vue from '@vitejs/plugin-vue'
// vite.config.js 文件
import eslintPlugin from 'vite-plugin-eslint'

// https://vitejs.dev/config/
export default defineConfig({
  plugins: [
    vue(),
    eslintPlugin({
      include: ['src/**/*.js', 'src/**/*.vue', 'src/*.js', 'src/*.vue']
    })
  ]
})
再次初始化项目
npm install
运行项目
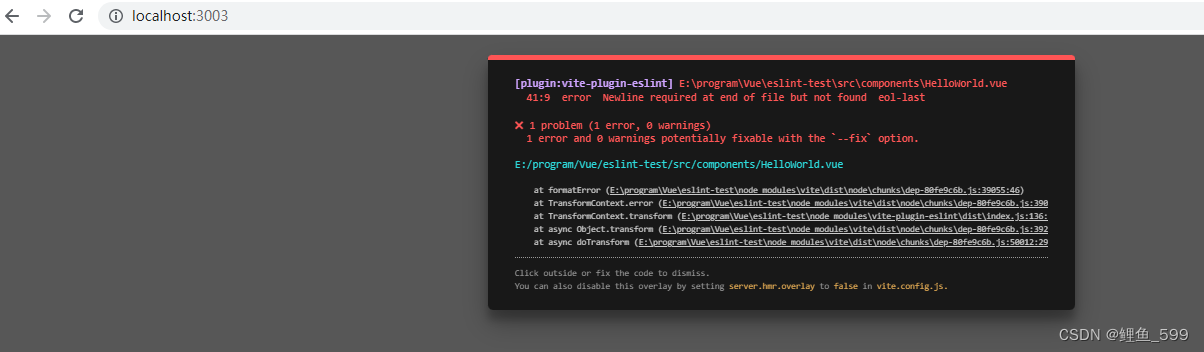
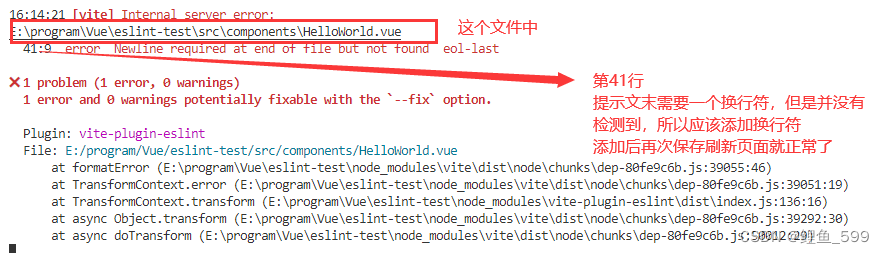
npm run dev
能够看到出现了提示
Over


 1736
1736


 被折叠的 条评论
为什么被折叠?
被折叠的 条评论
为什么被折叠?
 到【灌水乐园】发言


