


https://zhuanlan.zhihu.com/p/127013012
BIRCH
DBSCAN
K-均值
Mini-Batch K-均值
Mean Shift
OPTICS
光谱聚类
高斯混合
聚合聚类
数据集
make _ classification ()函数创建一个测试二分类数据集。数据集将有1000个示例,每个类有两个输入要素(两个特征x1,x2)和一个群集(标签,y)。
# 综合分类数据集
from numpy import where
from sklearn.datasets import make_classification
from matplotlib import pyplot
# 定义数据集
X, y = make_classification(n_samples=1000, n_features=2, n_informative=2,
                           n_redundant=0, n_clusters_per_class=1, random_state=4)
# 为每个类的样本创建散点图
for class_value in range(2):
# 获取此类的示例的行索引
    row_ix = where(y == class_value)
# 创建这些样本的散布
    pyplot.scatter(X[row_ix, 0], X[row_ix, 1])  #什么意思?
# 绘制散点图
pyplot.show()
![[外链图片转存失败,源站可能有防盗链机制,建议将图片保存下来直接上传(img-dla2wnJZ-1682302936584)(output_3_0.png)]](https://img-blog.csdnimg.cn/0bfa2342b6e249178867aad6a026c0ed.png)
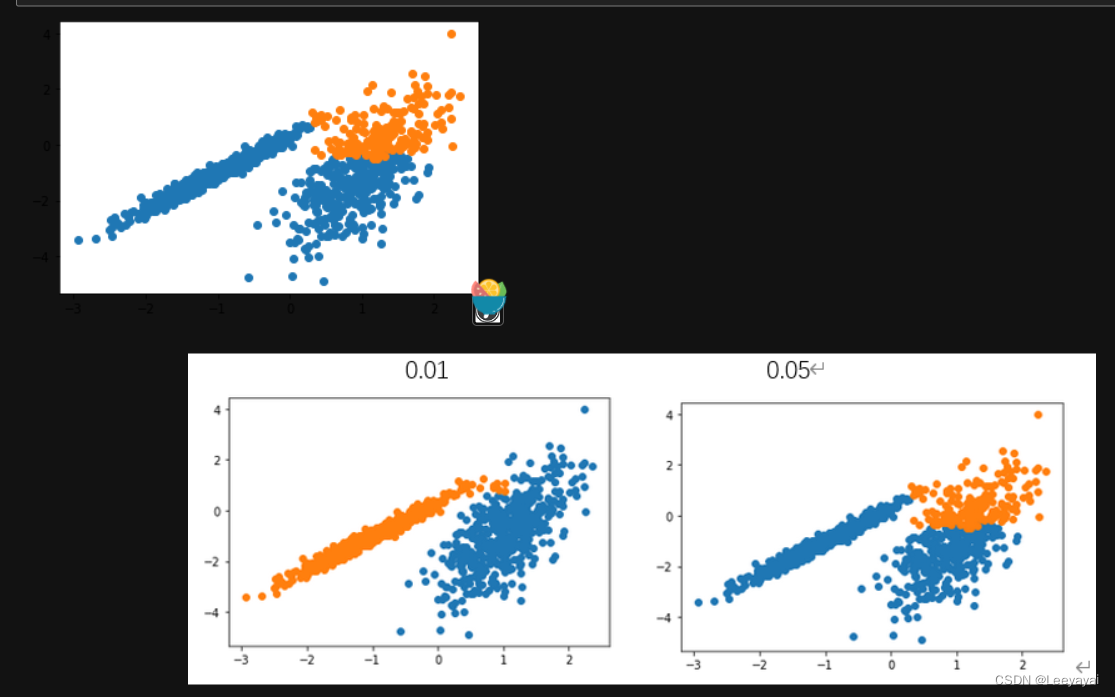
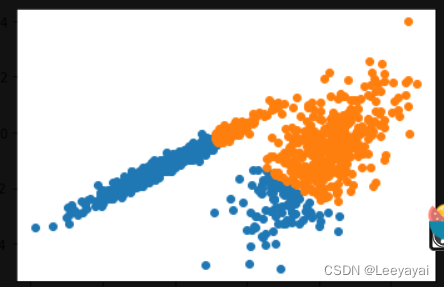
一:birch聚类
# birch聚类
from numpy import unique
from numpy import where
from sklearn.datasets import make_classification
from sklearn.cluster import Birch
from matplotlib import pyplot
# 定义数据集
X, _ = make_classification(n_samples=1000, n_features=2, n_informative=2,
                           n_redundant=0, n_clusters_per_class=1, random_state=4)
# 定义模型
model = Birch(threshold=0.05, n_clusters=2) ###调整这个threshold=0.05,控制聚类精度
# 适配模型
model.fit(X)
# 为每个示例分配一个集群
yhat = model.predict(X)
# 检索唯一群集
clusters = unique(yhat)
# 为每个群集的样本创建散点图
for cluster in clusters:
# 获取此群集的示例的行索引
    row_ix = where(yhat == cluster)
# 创建这些样本的散布
    pyplot.scatter(X[row_ix, 0], X[row_ix, 1])
# 绘制散点图
pyplot.show()
二:DBSCAN 聚类
DBSCAN 聚类(其中 DBSCAN 是基于密度的空间聚类的噪声应用程序)涉及在域中寻找高密度区域,并将其周围的特征空间区域扩展为群集。
from sklearn.cluster import DBSCAN
# 定义模型
# 定义数据集
X, _ = make_classification(n_samples=1000, n_features=2, n_informative=2,
                           n_redundant=0, n_clusters_per_class=1, random_state=4)
model = DBSCAN(eps=0.30, min_samples=20)  # eps领域内包含15个邻居,则将其设置维核心点
# 模型拟合与聚类预测
yhat = model.fit_predict(X)
# 检索唯一群集
clusters = unique(yhat)
# 为每个群集的样本创建散点图
for cluster in clusters:
# 获取此群集的示例的行索引
    row_ix = where(yhat == cluster)
# 创建这些样本的散布
    pyplot.scatter(X[row_ix, 0], X[row_ix, 1])
# 绘制散点图
pyplot.show()
![[外链图片转存失败,源站可能有防盗链机制,建议将图片保存下来直接上传(img-Qma8tMZT-1682302936587)(output_9_0.png)]](https://img-blog.csdnimg.cn/1d701e3da8834529a0ea4022ce545778.png)
import numpy as np
import matplotlib.pyplot as plt

from sklearn import cluster, datasets
from sklearn.preprocessing import StandardScaler

np.random.seed(0)

# 构建数据
n_samples = 1500
noisy_circles = datasets.make_circles(n_samples=n_samples, factor=0.5, noise=0.05)
noisy_moons = datasets.make_moons(n_samples=n_samples, noise=0.05)
blobs = datasets.make_blobs(n_samples=n_samples, random_state=8)

data_sets = [
    (
        noisy_circles,
        {
            "eps": 0.3,
            "min_samples": 7
        }
    ),
    (
        noisy_moons,
        {
            "eps": 0.3,
            "min_samples": 5
        }
    ),
    (
        blobs,
        {
            "eps": 0.3,
            "min_samples": 5
        }
    )
]
colors = ["#377eb8", "#ff7f00", "#4daf4a"]

plt.figure(figsize=(15, 5))

for i_dataset, (dataset, algo_params) in enumerate(data_sets):
    # 模型参数
    params = algo_params

    # 数据
    X, y = dataset
    X = StandardScaler().fit_transform(X)

    # 创建DBSCAN
    dbscan = cluster.DBSCAN(eps=params["eps"], min_samples=params['min_samples'])

    # 训练
    dbscan.fit(X)

    # 预测
    y_pred = dbscan.labels_.astype(int)

    y_pred_colors = []

    for i in y_pred:
        y_pred_colors.append(colors[i])

    plt.subplot(1, 3, i_dataset+1)

    plt.scatter(X[:, 0], X[:, 1], color=y_pred_colors)

plt.show()
![[外链图片转存失败,源站可能有防盗链机制,建议将图片保存下来直接上传(img-kOxC2Zjp-1682302936588)(output_10_0.png)]](https://img-blog.csdnimg.cn/2cc1402d4da24882a59ff1bd8cdcfb31.png)
三:K-means聚类
# k-means 聚类
from numpy import unique
from numpy import where
from sklearn.datasets import make_classification
from sklearn.cluster import KMeans
from matplotlib import pyplot
# 定义数据集
X, _ = make_classification(n_samples=1000, n_features=2, n_informative=2, n_redundant=0, n_clusters_per_class=1, random_state=4)
# 定义模型
model = KMeans(n_clusters=2)  # 只有一个聚为几类的参数,相当于没参数
# 模型拟合
model.fit(X)
# 为每个示例分配一个集群
yhat = model.predict(X)
# 检索唯一群集
clusters = unique(yhat)
# 为每个群集的样本创建散点图
for cluster in clusters:
# 获取此群集的示例的行索引
    row_ix = where(yhat == cluster)
# 创建这些样本的散布
    pyplot.scatter(X[row_ix, 0], X[row_ix, 1])
# 绘制散点图
pyplot.show()
![[外链图片转存失败,源站可能有防盗链机制,建议将图片保存下来直接上传(img-LJNrq49q-1682302936588)(output_12_0.png)]](https://img-blog.csdnimg.cn/d58cffe4f6da4f2aaa99f2000be036e2.png)
四:Mini-Batch K-均值
# mini-batch k均值聚类
from numpy import unique
from numpy import where
from sklearn.datasets import make_classification
from sklearn.cluster import MiniBatchKMeans
from matplotlib import pyplot
# 定义数据集
X, _ = make_classification(n_samples=1000, n_features=2,
                           n_informative=2, n_redundant=0, n_clusters_per_class=1, random_state=4)
# 定义模型
model = MiniBatchKMeans(n_clusters=2)
# 模型拟合
model.fit(X)
# 为每个示例分配一个集群
yhat = model.predict(X)
# 检索唯一群集
clusters = unique(yhat)
# 为每个群集的样本创建散点图
for cluster in clusters:
# 获取此群集的示例的行索引
    row_ix = where(yhat == cluster)
# 创建这些样本的散布
    pyplot.scatter(X[row_ix, 0], X[row_ix, 1])
# 绘制散点图
pyplot.show()
五:均值漂移聚类
# 均值漂移聚类
from numpy import unique
from numpy import where
from sklearn.datasets import make_classification
from sklearn.cluster import MeanShift
from matplotlib import pyplot
# 定义数据集
X, _ = make_classification(n_samples=1000, n_features=2, n_informative=2, n_redundant=0, n_clusters_per_class=1, random_state=4)
# 定义模型
model = MeanShift()
# 模型拟合与聚类预测
yhat = model.fit_predict(X)
# 检索唯一群集
clusters = unique(yhat)
# 为每个群集的样本创建散点图
for cluster in clusters:
# 获取此群集的示例的行索引
    row_ix = where(yhat == cluster)
# 创建这些样本的散布
    pyplot.scatter(X[row_ix, 0], X[row_ix, 1])
# 绘制散点图
pyplot.show()
![[外链图片转存失败,源站可能有防盗链机制,建议将图片保存下来直接上传(img-LbHBvyl1-1682302936590)(output_16_0.png)]](https://img-blog.csdnimg.cn/02b3fe0c0f2d416685d6c3b566efcb6a.png)
六:OPTICS (不好用??)
# optics聚类
from numpy import unique
from numpy import where
from sklearn.datasets import make_classification
from sklearn.cluster import OPTICS
from matplotlib import pyplot
# 定义数据集
X, _ = make_classification(n_samples=1000, n_features=2, n_informative=2, n_redundant=0, n_clusters_per_class=1, random_state=4)
# 定义模型
model = OPTICS(eps=0.2, min_samples=15)
# 模型拟合与聚类预测
yhat = model.fit_predict(X)
# 检索唯一群集
clusters = unique(yhat)
# 为每个群集的样本创建散点图
for cluster in clusters:
# 获取此群集的示例的行索引
    row_ix = where(yhat == cluster)
# 创建这些样本的散布
    pyplot.scatter(X[row_ix, 0], X[row_ix, 1])
# 绘制散点图
pyplot.show()
![[外链图片转存失败,源站可能有防盗链机制,建议将图片保存下来直接上传(img-kcUOmr1P-1682302936590)(output_18_0.png)]](https://img-blog.csdnimg.cn/b69ab37983524fd098a3a93aeec77b6a.png)
七:光谱聚类
# spectral clustering
from numpy import unique
from numpy import where
from sklearn.datasets import make_classification
from sklearn.cluster import SpectralClustering
from matplotlib import pyplot
# 定义数据集
X, _ = make_classification(n_samples=1000, n_features=2, n_informative=2, n_redundant=0, n_clusters_per_class=1, random_state=4)
# 定义模型
model = SpectralClustering(n_clusters=2)
# 模型拟合与聚类预测
yhat = model.fit_predict(X)
# 检索唯一群集
clusters = unique(yhat)
# 为每个群集的样本创建散点图
for cluster in clusters:
# 获取此群集的示例的行索引
    row_ix = where(yhat == cluster)
# 创建这些样本的散布
    pyplot.scatter(X[row_ix, 0], X[row_ix, 1])
# 绘制散点图
pyplot.show()
![[外链图片转存失败,源站可能有防盗链机制,建议将图片保存下来直接上传(img-59jnUcP6-1682302936591)(output_20_0.png)]](https://img-blog.csdnimg.cn/d47a6a1d8e714e108d5355178888e8e8.png)
八:高斯混合模型
# 高斯混合模型
from numpy import unique
from numpy import where
from sklearn.datasets import make_classification
from sklearn.mixture import GaussianMixture
from matplotlib import pyplot
# 定义数据集
X, _ = make_classification(n_samples=1000, n_features=2, n_informative=2, n_redundant=0, n_clusters_per_class=1, random_state=4)
# 定义模型
model = GaussianMixture(n_components=2)
# 模型拟合
model.fit(X)
# 为每个示例分配一个集群
yhat = model.predict(X)
# 检索唯一群集
clusters = unique(yhat)
# 为每个群集的样本创建散点图
for cluster in clusters:
# 获取此群集的示例的行索引
    row_ix = where(yhat == cluster)
# 创建这些样本的散布
    pyplot.scatter(X[row_ix, 0], X[row_ix, 1])
# 绘制散点图
pyplot.show()
![[外链图片转存失败,源站可能有防盗链机制,建议将图片保存下来直接上传(img-o30sqNOi-1682302936592)(output_22_0.png)]](https://img-blog.csdnimg.cn/8cd362bb9b0b4793ab30dae06f857d46.png)
# 聚合聚类
from numpy import unique
from numpy import where
from sklearn.datasets import make_classification
from sklearn.cluster import AgglomerativeClustering
from matplotlib import pyplot
# 定义数据集
X, _ = make_classification(n_samples=1000, n_features=2, n_informative=2, n_redundant=0, n_clusters_per_class=1, random_state=4)
# 定义模型
model = AgglomerativeClustering(n_clusters=2)
# 模型拟合与聚类预测
yhat = model.fit_predict(X)
# 检索唯一群集
clusters = unique(yhat)
# 为每个群集的样本创建散点图
for cluster in clusters:
# 获取此群集的示例的行索引
    row_ix = where(yhat == cluster)
# 创建这些样本的散布
    pyplot.scatter(X[row_ix, 0], X[row_ix, 1])
# 绘制散点图
pyplot.show()
![[外链图片转存失败,源站可能有防盗链机制,建议将图片保存下来直接上传(img-54ZdZV9K-1682302936592)(output_23_0.png)]](https://img-blog.csdnimg.cn/0b2d46a779b7493899562cb8b81899c4.png)


 2万+
2万+


 被折叠的 条评论
为什么被折叠?
被折叠的 条评论
为什么被折叠?
 到【灌水乐园】发言


