读取NTU-RGB-D数据集并利用关节信息生成gif

一、读取NTU-RGB-D数据集

        本文基于matlab2016实现。并需要先下载NTU-RGB-D数据集,打开下载的压缩包得到的是一组后缀名为skeleton 的文件,如图1.1所示

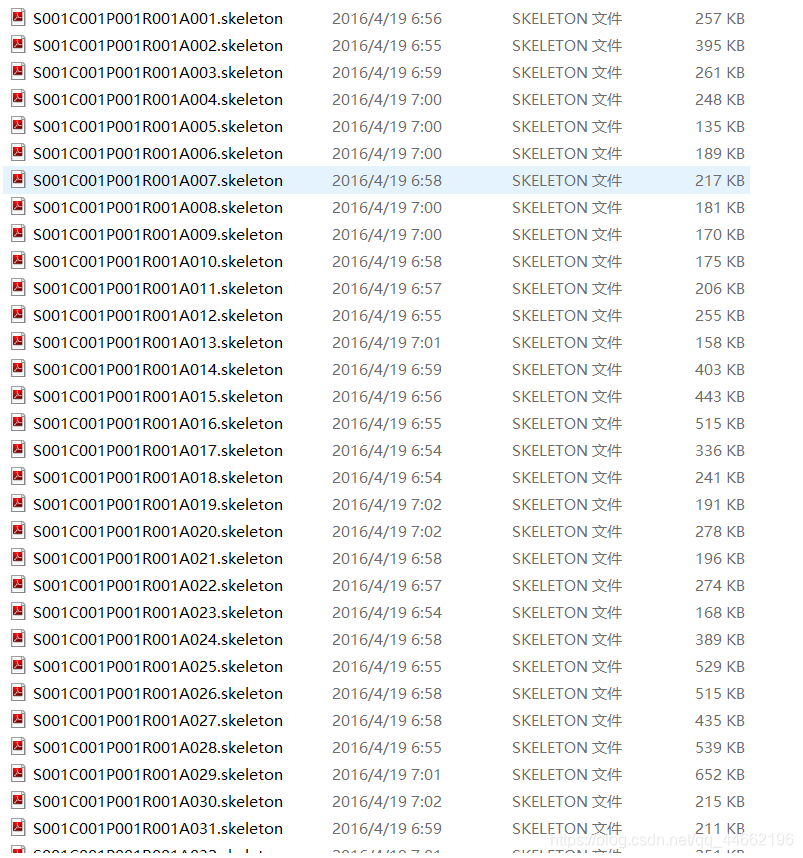
图1.1  NTU-RGB-D数据集中的 skeleton文件

        主函数如下

clc
clear
skeletonfilename = 'C:\Users\赵迪\Downloads\Raw_Skeleton_S01-S17\skeleton+D0-30000\S001C001P001R001A001.skeleton';
frames_count = 50;%用到的帧数
pic_num = 1;% 输出为gif文件用到的参数
bodyinfo = read_skeleton_file(skeletonfilename);
bodyinfo_frame=bodyinfo(103);
plot_frame(bodyinfo_frame);
figure(1);

for i = 1:numel(bodyinfo)
    bodyinfo_frame=bodyinfo(i);
    pause(0.05);
    plot_frame(bodyinfo_frame);
    F=getframe(gcf);
    I=frame2im(F);
    [I,map]=rgb2ind(I,256);
    if pic_num == 1
        imwrite(I,map,'S001C001P001R001A001.gif','gif','Loopcount',inf,'DelayTime',0.2);
    else
        imwrite(I,map,'S001C001P001R001A001.gif','gif','WriteMode','append','DelayTime',0.2);
    end
    pic_num = pic_num + 1;


end

           主函数包含读取skeleton文件,画图,生成gif三个步骤,读取 skeleton文件的函数名为

read_skeleton_file

        函数内容为

function bodyinfo = read_skeleton_file(filename)
% Reads an .skeleton file from "NTU RGB+D 3D Action Recognition Dataset".
% 
% Argrument:
%   filename: full adress and filename of the .skeleton file.
%
% For further information please refer to:
%   NTU RGB+D dataset's webpage: 
%       http://rose1.ntu.edu.sg/Datasets/actionRecognition.asp
%   NTU RGB+D dataset's github page: 
%        https://github.com/shahroudy/NTURGB-D
%   CVPR 2016 paper: 
%       Amir Shahroudy, Jun Liu, Tian-Tsong Ng, and Gang Wang, 
%       "NTU RGB+D: A Large Scale Dataset for 3D Human Activity Analysis", 
%       in IEEE Conference on Computer Vision and Pattern Recognition (CVPR), 2016
%
% For more details about the provided data, please refer to:
%   https://msdn.microsoft.com/en-us/library/dn799271.aspx
%   https://msdn.microsoft.com/en-us/library/dn782037.aspx
%测试用 skeletonfilename
fileid = fopen(filename);
framecount = fscanf(fileid,'%d',1); % no of the recorded frames
%A = fscanf(fileID,formatSpec,sizeA) 将文件数据读取到维度为 sizeA 的数组 A 中,
%并将文件指针定位到最后读取的值之后。
%fscanf 按列顺序填充 A。sizeA 必须为正整数
%或采用 [m n] 的形式,其中 m 和 n 为正整数。

bodyinfo = []; % to store multiple skeletons per frame

%在下面的代码部分中,点号表示结构体

for f = 1:framecount
    bodycount = fscanf(fileid,'%d',1); % no of observerd skeletons in current frame
    for b=1:bodycount
        clear body;
        body.bodyID = fscanf(fileid,'%ld',1); % tracking id of the skeleton
        arrayint = fscanf(fileid,'%d',6); % read 6 integers
        body.clipedEdges = arrayint(1);
        body.handLeftConfidence = arrayint(2);
        body.handLeftState = arrayint(3);
        body.handRightConfidence = arrayint(4);
        body.handRightState = arrayint(5);
        body.isResticted = arrayint(6);
        lean = fscanf(fileid,'%f',2);
        body.leanX = lean(1);
        body.leanY = lean(2);
        body.trackingState = fscanf(fileid,'%d',1);
        
        body.jointCount = fscanf(fileid,'%d',1); % no of joints (25)
        joints=[];
        for j=1:body.jointCount
            jointinfo = fscanf(fileid,'%f',11);
            joint=[];
            
            % 3D location of the joint j
            joint.x = jointinfo(1);
            joint.y = jointinfo(2);
            joint.z = jointinfo(3);
            
            % 2D location of the joint j in corresponding depth/IR frame
            joint.depthX = jointinfo(4);
            joint.depthY = jointinfo(5);
            
            % 2D location of the joint j in corresponding RGB frame
            joint.colorX = jointinfo(6);
            joint.colorY = jointinfo(7);
            
            % The orientation of the joint j
            joint.orientationW = jointinfo(8);
            joint.orientationX = jointinfo(9);
            joint.orientationY = jointinfo(10);
            joint.orientationZ = jointinfo(11);
            
            % The tracking state of the joint j
            joint.trackingState = fscanf(fileid,'%d',1);
            
            body.joints(j)=joint;
        end
        bodyinfo(f).bodies(b)=body;
    end
end
fclose(fileid);
end

二、画图

        在一帧图像中,将各个关节点的三维坐标连起来,各关节点的位置序号如图2.1所示

图2.1 各关节点排列及序号 

        画图用到的函数是plot_frame,函数内容如下

function  plot_frame(bodyinfo)
labels = ['01';'02';'03';'04';'05';'06';'07';'08';'09';'10';'11';'12';'13';'14';'15';'16';'17';...
    '18';'19';'20';'21';'22';'23';'24';'25'];
plotlian(bodyinfo,1,13);
plotlian(bodyinfo,13,14);
plotlian(bodyinfo,14,15);
plotlian(bodyinfo,15,16);
plotlian(bodyinfo,1,17);
plotlian(bodyinfo,17,18);
plotlian(bodyinfo,18,19);
plotlian(bodyinfo,19,20);
plotlian(bodyinfo,1,2);
plotlian(bodyinfo,2,21);
plotlian(bodyinfo,21,5);
plotlian(bodyinfo,5,6);
plotlian(bodyinfo,6,7);
plotlian(bodyinfo,7,8);
plotlian(bodyinfo,8,22);
plotlian(bodyinfo,8,23);
plotlian(bodyinfo,21,3);
plotlian(bodyinfo,3,4);
plotlian(bodyinfo,21,9);
plotlian(bodyinfo,9,10);
plotlian(bodyinfo,10,11);
plotlian(bodyinfo,11,12);
plotlian(bodyinfo,12,24);
plotlian(bodyinfo,12,25);
grid on;
% scatter3([bodyinfo.bodies().joints().x], [bodyinfo.bodies().joints().y],...
%     [ bodyinfo.bodies().joints().z]  );
x_axis = [bodyinfo.bodies().joints().x]-0.01;
y_axis = [bodyinfo.bodies().joints().y]-0.01;
z_axis = [bodyinfo.bodies().joints().z]-0.01;
% text(x_axis,y_axis,z_axis,labels,'Fontsize',6);
hold off
%测试代码部分
%x_axis = [bodyinfo(50).bodies().joints().x]-0.01;
% plotlian(i,0,1)
% plotlian(i,1,20)
% plotlian(i,20,2)
% plotlian(i,2,3)
% 
% plotlian(i,20,8)
% plotlian(i,8,9)
% plotlian(i,9,10)
% plotlian(i,10,11)
% plotlian(i,11,23)
% plotlian(i,10,24)
% 
% plotlian(i,20,4)
% plotlian(i,4,5)
% plotlian(i,5,6)
% plotlian(i,6,7)
% plotlian(i,6,22)
% plotlian(i,7,21)
% 
% plotlian(i,0,12)
% plotlian(i,12,13)
% plotlian(i,13,14)
% plotlian(i,14,15)
% 
% plotlian(i,0,16)
% plotlian(i,16,17)
% plotlian(i,17,18)
% plotlian(i,18,19)

% xlim([0 1]);
% ylim([-5 -2]);
% axis('ij');
% box('on');

        在画的过程中是依次连接相邻的两点,所以用到了plotlian函数,函数内容如下

function plotlian(bodyinfo,a,b)
R=rotz(180)*rotx(110);
a_axis = [bodyinfo.bodies().joints(a).x ;bodyinfo.bodies().joints(a).y;...
    bodyinfo.bodies().joints(a).z];
a_axis = R*a_axis;
b_axis = [bodyinfo.bodies().joints(b).x;bodyinfo.bodies().joints(b).y;...
    bodyinfo.bodies().joints(b).z ];
b_axis = R*b_axis;
x_axis = [a_axis(1); b_axis(1)];
y_axis = [a_axis(2); b_axis(2)];
z_axis = [a_axis(3); b_axis(3)];
plot3(x_axis,y_axis,z_axis);
xlabel('X');
ylabel('Y');
zlabel('N');
axis([-1,0.5,2,5,-2,0]);
% fprintf('\n %f,%f',bodyinfo(i).bodies().joints(a+1).x , bodyinfo(i).bodies().joints(b+1).x )
% fprintf('\n %f,%f',bodyinfo(i).bodies().joints(a+1).y , bodyinfo(i).bodies().joints(b+1).y )
% fprintf('\n %f,%f',bodyinfo(i).bodies().joints(a+1).z , bodyinfo(i).bodies().joints(b+1).z )
hold on


三、生成gif

        生成gif部分的函数内容如下

F=getframe(gcf);
    I=frame2im(F);
    [I,map]=rgb2ind(I,256);
    if pic_num == 1
        imwrite(I,map,'S001C001P001R001A001.gif','gif','Loopcount',inf,'DelayTime',0.2);
    else
        imwrite(I,map,'S001C001P001R001A001.gif','gif','WriteMode','append','DelayTime',0.2);
    end
    pic_num = pic_num + 1;

四、结尾

        文章写的很简略,代码中涉及到的细节和一些数据处理没有谈到,而且注释部分也并非完全没用,如有需要,评论区留言。

  • 1
    点赞
  • 11
    收藏
    觉得还不错? 一键收藏
  • 4
    评论

“相关推荐”对你有帮助么?

  • 非常没帮助
  • 没帮助
  • 一般
  • 有帮助
  • 非常有帮助
提交
评论 4
添加红包

请填写红包祝福语或标题

红包个数最小为10个

红包金额最低5元

当前余额3.43前往充值 >
需支付:10.00
成就一亿技术人!
领取后你会自动成为博主和红包主的粉丝 规则
hope_wisdom
发出的红包
实付
使用余额支付
点击重新获取
扫码支付
钱包余额 0

抵扣说明:

1.余额是钱包充值的虚拟货币,按照1:1的比例进行支付金额的抵扣。
2.余额无法直接购买下载,可以购买VIP、付费专栏及课程。

余额充值