


在微信小程序中使用echarts以及遇到的问题
一、 echarts使用步骤
1、下载
https://github.com/ecomfe/echarts-for-weixin.
2、引入组件
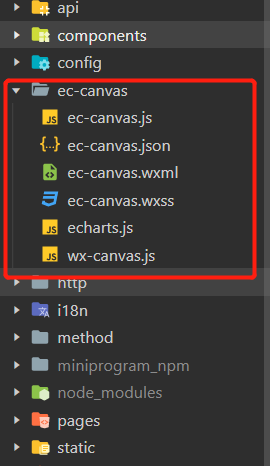
将下载好的组件放入小程序根目录,如图
3、页面简单使用
index.json
在需要用到echarts页面的.json文件中添加以下配置
"usingComponents": {
    "ec-canvas": "../../ec-canvas/ec-canvas"
  }
路径可以根据自己实际情况调整
index.wxml
在要使用的页面index.wxml 中,我们创建了一个 组件,内容如下:
<view class="container">
  <ec-canvas id="mychart-dom-bar" canvas-id="mychart-bar" ec="{{ ec }}"></ec-canvas>
</view>
index.js
其中 ec 是一个我们在 index.js 中定义的对象,它使得图表能够在页面加载后被初始化并设置。index.js 的结构如下:
import * as echarts from '../../ec-canvas/echarts';

function initChart(canvas, width, height, dpr) {
  const chart = echarts.init(canvas, null, {
    width: width,
    height: height,
    devicePixelRatio: dpr // 像素
  });
  canvas.setChart(chart);

  var option = {
    ...
  };
  chart.setOption(option);
  return chart;
}

Page({
  data: {
    ec: {
      onInit: initChart
    }
  }
});
index.wxss
ec-canvas {
  width: 100%;
  height: 100%;
}
.container {
  position: absolute;
  top: 0;
  bottom: 0;
  left: 0;
  right: 0;
}
4、封装组件
组件index.wxml
<view style="height: {{ height }};width:100%">
      <ec-canvas id="{{ chartLineId }}" canvas-id="{{ canvasId }}" ec="{{ec}}" options="{{options}}"></ec-canvas>
</view>
组件index.js
import * as echarts from '../../ec-canvas/echarts'

Component({
  /**
   * 组件的属性列表
   */
  properties: {
    chartLineId: {
      type: String
    },
    canvasId: {
      type: String
    },
    height: {
      type: String
    },
    options: {
      type: Object
    },
    isshow:{ // 是否首次加载
      type:Boolean
    }
  },

  /**
   * 组件的初始数据
   */
  data: {
    ec: {
      lazyLoad: true, // 延迟加载
    },
  },
  lifetimes: {
    ready() {
      this[this.data.chartLineId] = this.selectComponent('#' + this.data.chartLineId);
      this.isshow?this.initChart():''  // 因为自己项目有在弹框里面展示echarts的,有页面加载直接展示的,所以这里有区分。
    },
    detached(e) {
      this[this.data.chartLineId] = null
      this[this.data.canvasId] = null
    },
  },
  /**
   * 组件的方法列表
   */
  methods: {
    initChart() {
      this[this.data.chartLineId].init((canvas, width, height, dpr) => {
        const chart = echarts.init(canvas, null, {
          width: width,
          height: height,
          devicePixelRatio: dpr // new
        })
        chart.setOption(this.data.options)
        return chart
      })
    }
  }
})
在页面使用index.wxml
<block wx:for="{{optionData}}" wx:key="index">
    <chart isshow="false" id="chart{{index}}" options="{{item.options}}" canvasId="mychart-id" chartLineId="mychart{{index}}" height="400rpx"></chart>
</block>
在页面使用index.js
data: {
	optionData: [], // echarts data
}

onLoad: function (options) {
	this.getChartsData(true)
}
/**
* method
*/
    // 请求echarts图标数据
    getChartsData(type) {
        queryGtAndDiffListApi().then(res => {
            res.gtAndDiffWeeksDTOList.forEach(item => { // 处理接口数据
                item.data1 = [item.weCTotal, item.wePTotal, item.weNTotal]
                item.data2 = [item.gtCTotal, item.gtPTotal, item.gtNTotal]
            })
            if (type) {  // 这里是区分首次加载还是分页下拉加载数据
                this.setData({
                    'filterPage.total': res.total,
                    'optionData': res.gtAndDiffWeeksDTOList
                })
            } else {
                this.setData({
                    'filterPage.total': res.total,
                    'optionData': [...this.data.optionData, ...res.gtAndDiffWeeksDTOList]
                })
            }
            setTimeout(() => {
                this.setOption()
            }, 200);
        })
    },
    setOption() {
        for (let i = 0; i < this.data.optionData.length; i++) {
            this.data.optionData[i].options = this.getOption(this.data.optionData[i].weekEndingEn, this.data.optionData[i].data1, this.data.optionData[i].data2)
            data = this.data.optionData
            this.chart = this.selectComponent(`#chart${i}`);
            this.setData({
                optionData: this.data.optionData
            })
            this.chart.initChart()
        }
    },
    getOption(title, data1, data2) {
        let opation = {
            title: {
                text: 'Weekend: ' + title,
                padding: 30,
                textStyle: {
                    color: '#000000',
                    fontSize: '30rpx',
                },
            },
            grid: {
                left: '2%',
                right: '2%',
                bottom: '3%',
                containLabel: true
            },
            yAxis: {
                type: 'value',
            },
            xAxis: {
                type: 'category',
                data: ['C', 'P', 'N']
            },
            series: [{
                    name: '2011年',
                    type: 'bar',
                    color: '#E9E9E9',
                    data: data1
                },
                {
                    name: '2012年',
                    type: 'bar',
                    color: '#FFE600',
                    data: data2
                }
            ]
        }
        return opation
    }
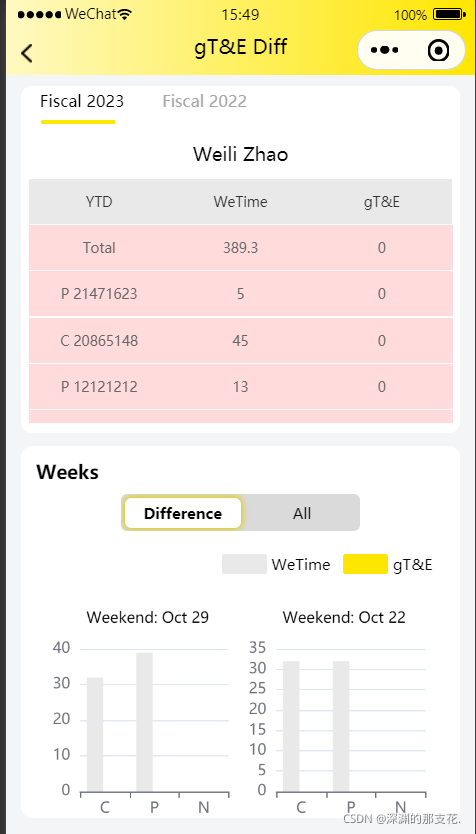
效果展示 : 底下echarts是分页展示的,下滑继续加载
二、遇到问题
1、使用echarts不跟随父元素滑动的问题
这个问题的现象说起来很简单。
小程序页面中底部有Echarts图表,手指上下滑动观看内容。但是手指滑动区域在Echarts图表上时,页面却不能滑动了。
个人认为是小程序的canvas在加载的时候只展示页面可视区域的图表,在网上查了很多办法都没有解决,最后在一位大佬的建议下自己摸索出来了
最终解决方案
用scroll-view将echarts要显示的区域包裹,在每次页面滚动时触发bindscroll函数,重新加载echarts图表
代码如下:
bindscroll是每次滚动时触发的这里调一下echarts
bindscrolltolower是滚动到底部时触发这里是做分页的
<scroll-view scroll-y="true" bindscroll="scroll" bindscrolltolower="scrolltolowe" style="height:75%;">
        <!-- echart -->
        <view class="chart-box">
          <block wx:for="{{optionData}}" wx:key="index">
            <view class="chart-item">
              <navigator url="../GTEWeekDiff/index?week={{item.weekEnding}}&weekEn={{item.weekEndingEn}}&&year={{year}}&&gpn={{gpn}}"
                hover-class="none">
                <chart isshow="false" id="chart{{index}}" options="{{item.options}}" canvasId="mychart-id"
                  chartLineId="mychart{{index}}" height="400rpx">
                </chart>
              </navigator>
            </view>
          </block>
        </view>
      </scroll-view>


   // echarts 滚动时
    scroll(e) {
        clearTimeout(this._st)
        this._st = setTimeout(() => {
            this.setOption()
        }, 100);
    },

    // echarts下拉事件
    scrolltolowe() {
        if (this.data.filterPage.pageNum * this.data.filterPage.pageSize < this.data.filterPage.total) {
            this.setData({
                'filterPage.pageNum': this.data.filterPage.pageNum + 1
            })
            this.getChartsData(false)
        }
    },
最终完美的解决了问题 ,在安卓和IOS都没问题,亲测有效如上图


 8916
8916


 被折叠的 条评论
为什么被折叠?
被折叠的 条评论
为什么被折叠?
 到【灌水乐园】发言


