一个人可以被摧毁,但不能被打败。
A man can be destroyed but not defeated
原作者的github
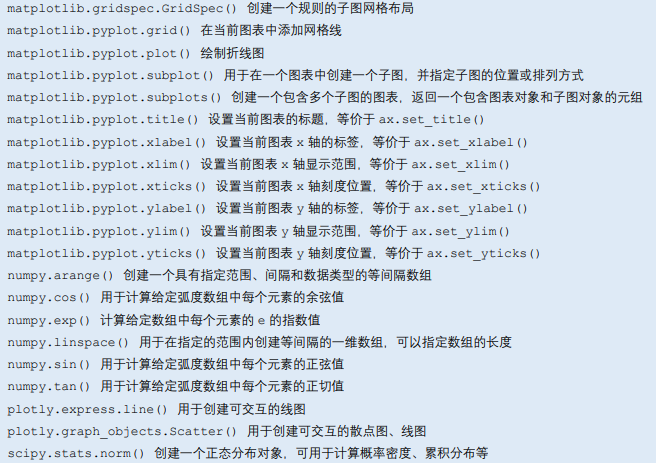
主要内容Matplotlib,Plotly如何绘制线图
文章目录

思维导图

解剖图


代码:图像的要素和标注
import matplotlib.pyplot as plt
import numpy as np

from matplotlib.patches import Circle
from matplotlib.patheffects import withStroke
from matplotlib.ticker import AutoMinorLocator, MultipleLocator
royal_blue = [0, 20/256, 82/256]


# make the figure

np.random.seed(19680801)

X = np.linspace(0.5, 3.5, 100)
Y1 = 3+np.cos(X)
Y2 = 1+np.cos(1+X/0.75)/2
#均匀分布
Y3 = np.random.uniform(Y1, Y2, len(X))
Python


fig = plt.figure(figsize=(7.5, 7.5))

# 添加坐标轴
ax = fig.add_axes([0.2, 0.17, 0.68, 0.7], aspect=1)

# 设置坐标轴刻度
#主刻度和次刻度
ax.xaxis.set_major_locator(MultipleLocator(1.000))
ax.xaxis.set_minor_locator(AutoMinorLocator(4))
ax.yaxis.set_major_locator(MultipleLocator(1.000))
ax.yaxis.set_minor_locator(AutoMinorLocator(4))
ax.xaxis.set_minor_formatter("{x:.2f}")

# 设置坐标轴范围
ax.set_xlim(0, 4)
ax.set_ylim(0, 4)

# 设置坐标轴刻度样式
ax.tick_params(which='major', width=1.0, length=10, labelsize=14)
ax.tick_params(which='minor', width=1.0, length=5, labelsize=10,
               labelcolor='0.25')

# 添加网格
ax.grid(linestyle="--", linewidth=0.5, color='.25', zorder=-10)

# 添加线条
ax.plot(X, Y1, c='C0', lw=2.5, label="Blue signal", zorder=10)
ax.plot(X, Y2, c='C1', lw=2.5, label="Orange signal")
# 添加标记
ax.plot(X[::3], Y3[::3], linewidth=0, markersize=9,
        marker='s', markerfacecolor='none', markeredgecolor='C4',
        markeredgewidth=2.5)

# 添加标题
ax.set_title("Anatomy of a figure", fontsize=20, verticalalignment='bottom')
# 添加x轴标签
ax.set_xlabel("x Axis label", fontsize=14)
# 添加y轴标签
ax.set_ylabel("y Axis label", fontsize=14)
# 添加图例
ax.legend(loc="upper right", fontsize=14)

# 定义一个注释函数
def annotate(x, y, text, code):
    # 画圆形标记,绘制的位置
    c = Circle((x, y), radius=0.15, clip_on=False, zorder=10, linewidth=2.5,
               edgecolor=royal_blue + [0.6], facecolor='none',
               path_effects=[withStroke(linewidth=7, foreground='white')])

    ax.add_artist(c)

    # 使用path_effects作为文本的背景
    # 先绘制path_effects和带有颜色的文本,以便path_effects不会剪切其他文本
    for path_effects in [[withStroke(linewidth=7, foreground='white')], []]:
        color = 'white' if path_effects else royal_blue
        ax.text(x, y-0.2, text, zorder=100,
                ha='center', va='top', weight='bold', color=color,
                style='italic', fontfamily='monospace',
                path_effects=path_effects)

        color = 'white' if path_effects else 'black'
        ax.text(x, y-0.33, code, zorder=100,
                ha='center', va='top', weight='normal', color=color,
                fontfamily='monospace', fontsize='medium',
                path_effects=path_effects)

annotate(3.5, -0.13, "Minor tick label", "ax.xaxis.set_minor_formatter")
annotate(-0.03, 1.0, "Major tick", "ax.yaxis.set_major_locator")
annotate(0.00, 3.75, "Minor tick", "ax.yaxis.set_minor_locator")
annotate(-0.15, 3.00, "Major tick label", "ax.yaxis.set_major_formatter")
annotate(1.68, -0.39, "xlabel", "ax.set_xlabel")
annotate(-0.38, 1.67, "ylabel", "ax.set_ylabel")
annotate(1.52, 4.15, "Title", "ax.set_title")
annotate(1.75, 2.80, "Line", "ax.plot")
annotate(2.25, 1.54, "Markers", "ax.scatter")
annotate(3.00, 3.00, "Grid", "ax.grid")
annotate(3.60, 3.58, "Legend", "ax.legend")
annotate(2.5, 0.55, "Axes", "fig.subplots")
annotate(4, 4.5, "Figure", "plt.figure")
annotate(0.65, 0.01, "x Axis", "ax.xaxis")
annotate(0, 0.36, "y Axis", "ax.yaxis")
annotate(4.0, 0.7, "Spine", "ax.spines")

# frame around figure
fig.patch.set(linewidth=4, edgecolor='0.5')
plt.show()

使用Matplotlib绘制线图

代码2:绘制正弦和余弦的图像
# 导入包
import numpy as np
import matplotlib.pyplot as plt

# 生成横轴数据
x_array = np.linspace(0, 2*np.pi, 100)
# 正弦函数数据
sin_y = np.sin(x_array)
# 余弦函数数据
cos_y = np.cos(x_array)
# 设置图片大小
fig, ax = plt.subplots(figsize=(8, 6))

# 绘制正弦和余弦曲线
ax.plot(x_array, sin_y,
        label='sin', color='b', linewidth=2)
ax.plot(x_array, cos_y,
        label='cos', color='r', linewidth=2)

# 设置标题、横轴和纵轴标签
ax.set_title('Sine and cosine functions')
ax.set_xlabel('x')
ax.set_ylabel('f(x)')

# 添加图例
ax.legend()

# 设置横轴和纵轴范围
ax.set_xlim(0, 2*np.pi)
ax.set_ylim(-1.5, 1.5)

# 设置横轴标签和刻度标签
x_ticks = np.arange(0, 2*np.pi+np.pi/2, np.pi/2)
x_ticklabels = [r'$0$', r'$\frac{\pi}{2}$',
                r'$\pi$', r'$\frac{3\pi}{2}$',
                r'$2\pi$']
ax.set_xticks(x_ticks)
ax.set_xticklabels(x_ticklabels)

# 横纵轴采用相同的scale
ax.set_aspect('equal')
plt.grid()
# 将图片存成SVG格式
plt.savefig('正弦_余弦函数曲线.svg', format='svg')

# 显示图形
plt.show()

首先定义图像对象


图像存储格式的说明
用 matplotlib.pyplot.savefig(),简做 plt.savefig(),保存图片

后期的美化和说明文字使用python添加成本较高。

代码3子图的绘制

import numpy as np
import matplotlib.pyplot as plt

x = np.linspace(0, 2*np.pi, 100)
y = np.sin(x)

fig = plt.figure()
ax = fig.add_subplot(1, 1, 1)
ax.plot(x, y)
plt.show()
绘制一行两列的子图
import numpy as np
import matplotlib.pyplot as plt

x = np.linspace(0, 2 * np.pi, 100)
y_sin = np.sin(x)
y_cos = np.cos(x)
# 创建图形对象和子图布局
fig, (ax1, ax2) = plt.subplots(1, 2,
                  figsize=(10, 4),
                  sharey=True)

# 在左子图中绘制正弦函数曲线,设置为蓝色
ax1.plot(x, y_sin, color='blue')
ax1.set_title('Sine function')
ax1.set_xlabel('x')
ax1.set_ylabel('f(x)',
               rotation='horizontal',
               ha='right')
ax1.set_xlim(0, 2*np.pi)
ax1.set_ylim(-1.5, 1.5)
x_ticks = np.arange(0, 2*np.pi+np.pi/2, np.pi)
x_ticklabels = [r'$0$', r'$\pi$', r'$2\pi$']
ax1.set_xticks(x_ticks)
ax1.set_xticklabels(x_ticklabels)
ax1.grid(True)
ax1.set_aspect('equal')

# 在右子图中绘制余弦函数曲线,设置为红色
ax2.plot(x, y_cos, color='red')
ax2.set_title('Cosine function')
ax2.set_xlabel('x')
ax2.set_ylabel('f(x)',
               rotation='horizontal',
               ha='right')
ax2.set_xlim(0, 2*np.pi)
ax2.set_ylim(-1.5, 1.5)
ax2.set_xticks(x_ticks)
ax2.set_xticklabels(x_ticklabels)
ax2.grid(True)
ax2.set_aspect('equal')

# 调整子图之间的间距
plt.tight_layout()

# 显示图形
plt.show()

plt和ax函数的比较

在使用
matplotlib时,plt和ax是两个常见的概念,但它们在职责和使用方式上有所不同。以下是它们的区别:
plt(matplotlib.pyplot):
plt是matplotlib.pyplot模块的缩写,通常作为顶层的绘图接口。- 你可以使用
plt来创建和管理整个图形对象(Figure),并调用各种方法绘制图像,例如折线图、散点图等。plt类似于一个全局的状态机,许多操作是隐式的。例如,使用plt.plot()就会在当前的图形中添加数据。- 通常用于快速绘图和简单的场景,不需要手动管理多个图形或坐标轴。
 import matplotlib.pyplot as plt
plt.plot([1, 2, 3], [4, 5, 6])  # 创建一个折线图    plt.show()  # 显示图像
ax(Axes对象):
ax是Axes对象,代表图中的一个子区域,是真正绘制图形的地方。Axes是Figure(图形)的组成部分。- 通过
ax,你可以更细粒度地控制图形的每个部分,包括坐标轴、标题、标签等。- 当你需要绘制多个子图(subplots)或对图形的布局、样式进行更精细的控制时,通常会显式地使用
ax对象。- 通过
plt.subplots()或plt.gca()(获取当前Axes)来创建或获取ax对象。
python    import matplotlib.pyplot as plt
fig, ax= plt.subplots()  # 创建图形和坐标轴
ax.plot([1, 2, 3], [4, 5, 6])  # 在指定的坐标轴上绘图
ax.set_title('My Plot')  # 设置图表标题    plt.show()  # 显示图像
总结:
plt是高层接口,方便快速生成图表。ax是底层对象,用于更精细的图形控制,尤其适用于复杂的布局和定制。
图片美化


常用的色谱和颜色

matplotlib的色彩说明
Matplotlib的默认设置参数

import matplotlib.pyplot as plt
p = plt.rcParams # 全局配置参数
print(p)
# plt.rcParams 配置参数的当前默认值


使用Plotly 绘制线图
# 导入包
import plotly.express as px
import numpy as np

# 生成横轴数据
x = np.linspace(0, 2 * np.pi, 100)

# 生成正弦和余弦曲线数据
y_sin = np.sin(x)
y_cos = np.cos(x)
# 创建图表
fig = px.line(x=x, y=[y_sin, y_cos],
              labels={'y': 'f(x)', 'x': 'x'})
# 修改图例
fig.data[0].name = 'Sine'
fig.data[1].name = 'Cosine'
# 显示图表
fig.show()
产生的图片是可交互的,可以缩放,查看数值


探究学习

在这个网站的配图进行运行和注释
https://matplotlib.org/stable/plot_types/index.html
主要分类
- 配对数据
- 统计分布
- 网格数据
- 不规则网格数据
- 三维和体积数据


 被折叠的 条评论
为什么被折叠?


