


 本文介绍了一种改进的代码实现,旨在提供更直观的图像标注功能,使用Yolov5在VisDrone2019数据集上进行实例,并能统计各类别的边界框数量,有助于减少代码抄袭问题。
很多博主的代码都不太直观,对于大多人都不太友好,而且复制粘贴盗用别人代码情况也很严重,可能他在自己都不太清楚。
代码我已经写得很直观了,按照提示操作即可。
# -*- coding: utf-8 -*-
import cv2
import os

def draw_box_in_single_image(image_path, txt_path, save_path, class_colors, show_labels, label_names=None, show_image=False):
    image = cv2.imread(image_path)
    if image is None:
        print(f"读取失败: {image_path}")
        return None
    if not os.path.exists(save_path):
        os.makedirs(save_path)

    def read_list(txt_path):
        pos = []
        with open(txt_path, 'r') as file_to_read:
            while True:
                lines = file_to_read.readline()
                if not lines:
                    break
                p_tmp = [float(i) for i in lines.split(' ')]
                pos.append(p_tmp)
        return pos

    def convert(size, box):
        xmin = (box[1] - box[3] / 2.) * size[1]
        xmax = (box[1] + box[3] / 2.) * size[1]
        ymin = (box[2] - box[4] / 2.) * size[0]
        ymax = (box[2] + box[4] / 2.) * size[0]
        box = (int(xmin), int(ymin), int(xmax), int(ymax))
        return box

    pos = read_list(txt_path)
    if not pos:
        print(f"无法找到目标框: {txt_path}")
        return None
    class_count = {}
    for i in range(len(pos)):
        label_index = int(pos[i][0])
        if label_names:
            if label_index >= len(label_names):
                print(f"无效标签: {label_index} in {txt_path}")
                continue
            label = label_names[label_index]
        else:
            label = f"类别{label_index}"

        box = convert(image.shape, pos[i])
        color = class_colors.get(label, (0, 0, 0))
        image = cv2.rectangle(image, (box[0], box[1]), (box[2], box[3]), color, 1) # 边界框粗细
        if show_labels:
            cv2.putText(image, label, (box[0], box[1] - 2), 0, 1, color, thickness=1, lineType=cv2.LINE_AA) # 字体粗细
        class_count[label] = class_count.get(label, 0) + 1

    save_image_path = os.path.join(save_path, '{}.png'.format(image_path.split(os.path.sep)[-1][:-4]))
    cv2.imwrite(save_image_path, image)
    print("图片保存于:", save_image_path)
    if show_image:
        cv2.imshow("images", image)
        cv2.waitKey(1000) # 时间间隔
        cv2.destroyAllWindows()
    return pos, class_count

def main(img_folder, label_folder, save_folder, class_colors, show_labels, label_names=None, show_image=False, output_folder_total=None, output_folder_single=None):
    img_list = os.listdir(img_folder)
    img_list.sort()
    label_list = os.listdir(label_folder)
    label_list.sort()
    if output_folder_single and not os.path.exists(output_folder_single):
        os.makedirs(output_folder_single)
    total_count = 0
    class_count_total = {}
    for i in range(len(img_list)):
        image_path = os.path.join(img_folder, img_list[i])
        txt_path = os.path.join(label_folder, label_list[i])
        pos, class_count = draw_box_in_single_image(image_path, txt_path, save_folder, class_colors, show_labels, label_names, show_image)
        if not pos:
            continue
        total_count += len(pos)
        if output_folder_single:
            output_txt_path = os.path.join(output_folder_single, label_list[i])
            with open(output_txt_path, 'w') as f:
                for label, count in class_count.items():
                    f.write(f"{label}': {count}\n")
                    class_count_total[label] = class_count_total.get(label, 0) + count
                f.write(f"总框数量: {len(pos)}\n")
    if output_folder_total and not os.path.exists(output_folder_total):
        os.makedirs(output_folder_total)
    if output_folder_total:
        with open(os.path.join(output_folder_total, '总框数统计.txt'), 'w') as f:
            for label, count in class_count_total.items():
                f.write(f"'{label}':{count}\n")
            f.write(f"总框数量: {total_count}\n")

if __name__ == "__main__":
    # 图片文件夹路径(尽量绝对路径)
    img_folder = "Y:\yolov5-v7.0\my_dataset\VisDrone2019\images/val"
    # 标签路径
    label_folder = "Y:\yolov5-v7.0\my_dataset\VisDrone2019\labels/val"
    # 边界框保存路径
    save_folder = "Y:\yolov5-v7.0/exp_text/view"
    # 统计单标签
    output_folder_total = "Y:\yolov5-v7.0\exp_text\output_total"
    # 统计总标签
    output_folder_single = "Y:\yolov5-v7.0\exp_text\output_single"
    # 开启后显示一张图片,保存一张绘制好的图片
    show_image = True
    # 是否显示标签名
    show_labels = False
    # 边界框颜色
    class_colors = {
        "pedestrian": (255, 0, 0), "people": (0, 255, 0), "bicycle": (0, 0, 255), "car": (255, 255, 0),
        "van": (0, 255, 85), "truck": (55, 10, 255), "tricycle": (128, 0, 0), "awning-tricycle": (0, 128, 772),
        "bus": (123, 0, 28), "motor": (58, 0, 0)
    }
    # 标签名(参考txt标签的数字,例如car对应3,就放在第3个位置),必须对应好,否则后续的统计就乱了
    label_names = ['pedestrian', 'people', 'bicycle', 'car', 'van', 'truck', 'tricycle', 'awning-tricycle', 'bus', 'motor']


    main(img_folder, label_folder, save_folder, class_colors, show_labels, label_names, show_image, output_folder_total, output_folder_single)

    """
    如果要调整字体、边框粗细、图片播放间隔,参考49、51、59行代码,默认值分别为:1、1、1000
    """
效果展示
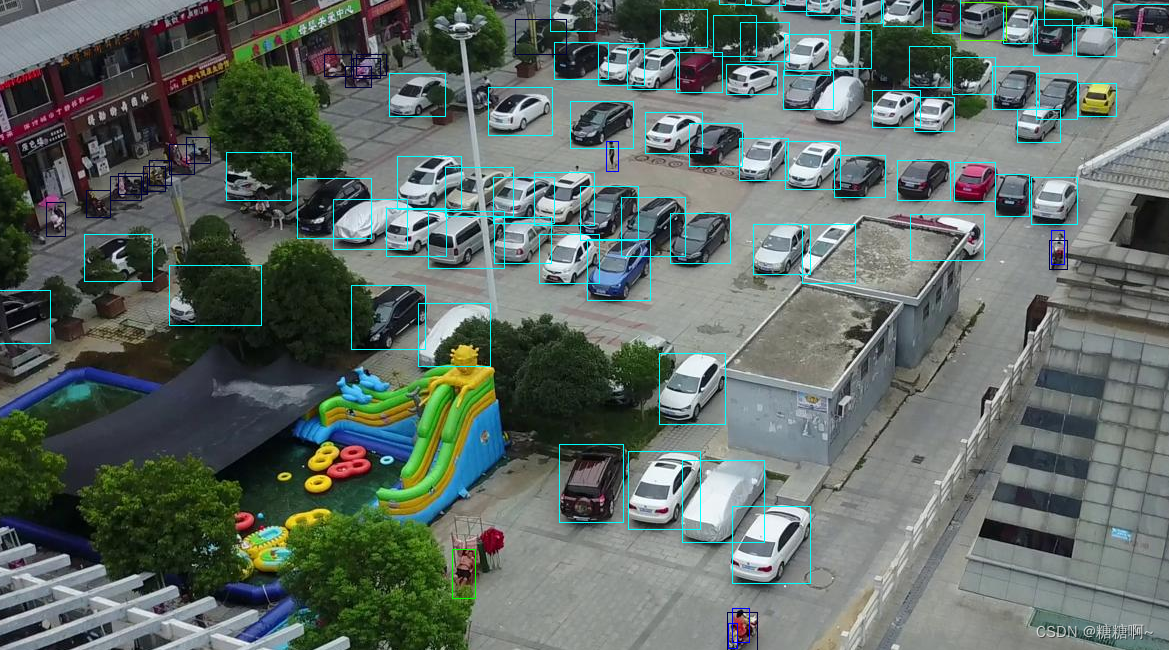
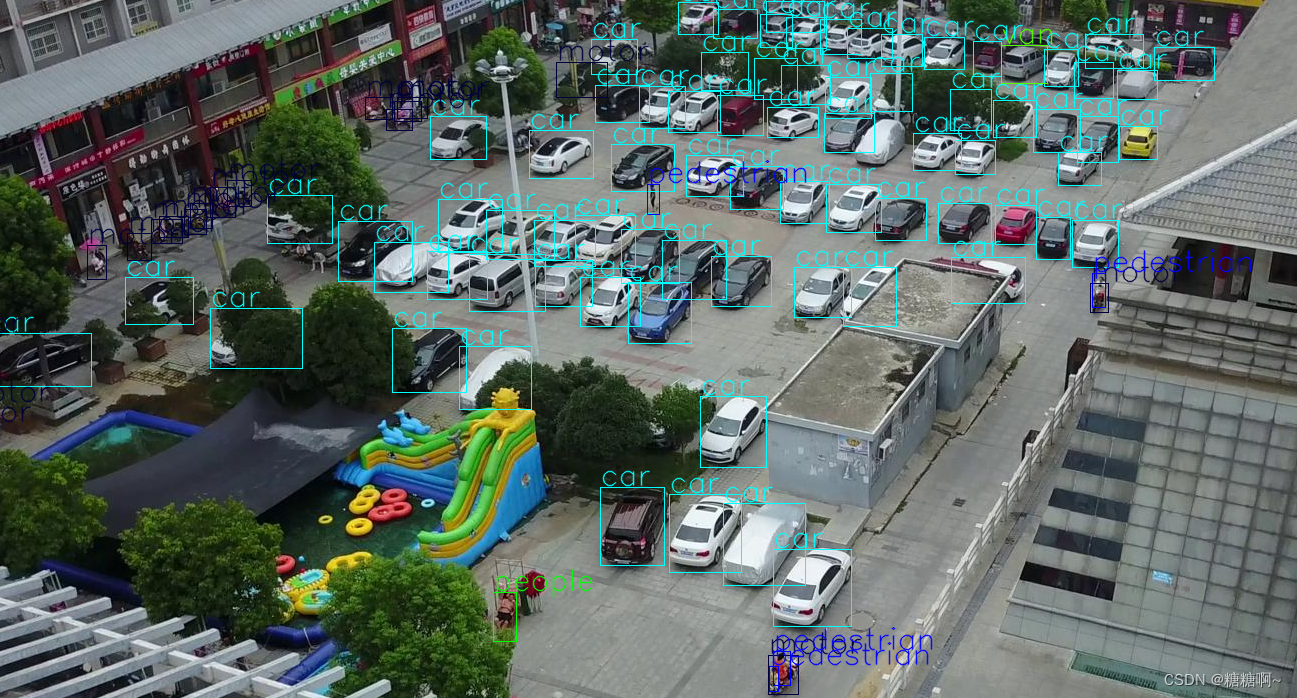
开启图片播放后可以自定义是否开启标签
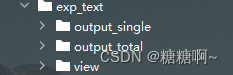
代码运行完毕后的结果
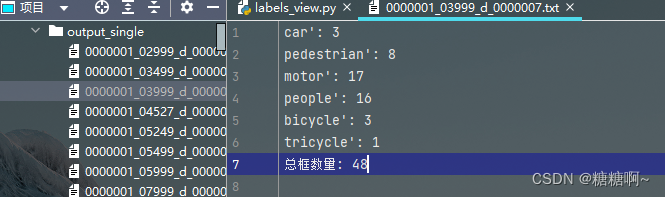
单个标签的统计结果
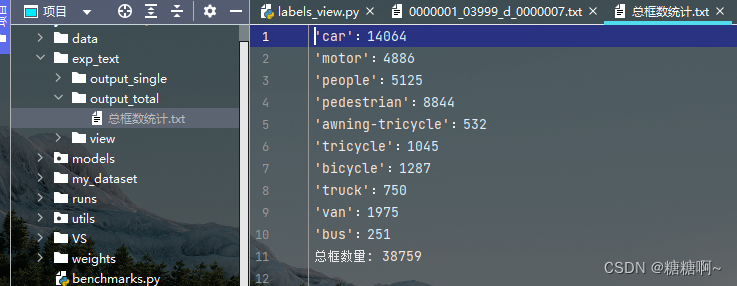
所有标签的统计结果
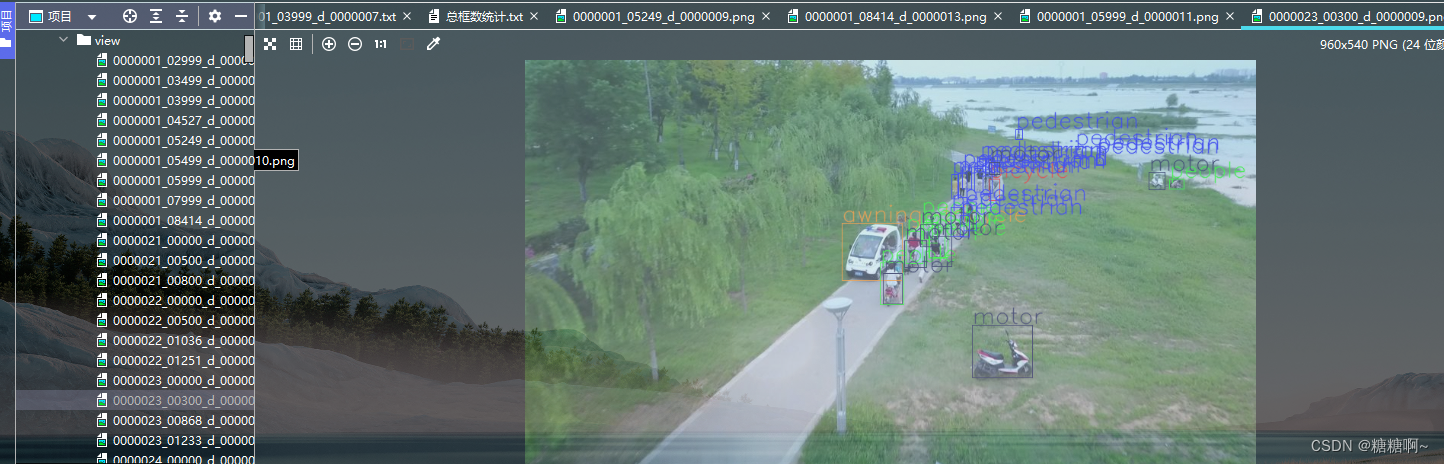
带上标签的图片
注:如果生成的txt出现乱码,可以改为其他的编码方式,或者直接去磁盘里看


 1453
1453


 被折叠的 条评论
为什么被折叠?
被折叠的 条评论
为什么被折叠?
 到【灌水乐园】发言


