


介绍:Shiny 是一个开源 R 包,它提供了一个优雅而强大的 Web 框架,用于使用 R 构建 Web 应用程序。Shiny 可以帮助您将分析转变为交互式 Web 应用程序,而无需 HTML、CSS 或 JavaScript 知识。
# download R package
pkgtest <- function(x){
    if(x %in% rownames(installed.packages()) == FALSE){
        install.packages(x,dependencies = TRUE)
    }
    library(x,character.only = TRUE)

}
neededpackages <- c("shiny","dplyr","plotly","readxl","DT","ggExtra")
for(package in neededpackages){pkgtest(package)}


library(shiny)
library(bslib)
library(dplyr)
library(ggplot2)
library(ggExtra)


penguins_csv <- "E:\\BaiduSyncdisk\\A-Area longtime\\R language\\Niche\\temp_data.csv"

df <- readr::read_csv(penguins_csv)
# Find subset of columns that are suitable for scatter plot
df_num <- df |> select(where(is.numeric), -Year)

ui <- page_sidebar(
    sidebar = sidebar(
        varSelectInput("xvar", "X variable", df_num, selected = "Bill Length (mm)"),
        varSelectInput("yvar", "Y variable", df_num, selected = "Bill Depth (mm)"),
        checkboxGroupInput(
            "species", "Filter by species",
            choices = unique(df$Species),
            selected = unique(df$Species)
        ),
        hr(), # Add a horizontal rule
        checkboxInput("by_species", "Show species", TRUE),
        checkboxInput("show_margins", "Show marginal plots", TRUE),
        checkboxInput("smooth", "Add smoother"),
    ),
    plotOutput("scatter")
)

server <- function(input, output, session) {
    subsetted <- reactive({
        req(input$species)
        df |> filter(Species %in% input$species)
    })

    output$scatter <- renderPlot({
        p <- ggplot(subsetted(), aes(!!input$xvar, !!input$yvar)) + list(
            theme(legend.position = "bottom"),
            if (input$by_species) aes(color = Species),
            geom_point(),
            if (input$smooth) geom_smooth()
        )

        if (input$show_margins) {
            margin_type <- if (input$by_species) "density" else "histogram"
            p <- ggExtra::ggMarginal(p, type = margin_type, margins = "both",
                                     size = 8, groupColour = input$by_species, groupFill = input$by_species)
        }

        p
    }, res = 100)
}

shinyApp(ui, server)
所需要的资料下载:https://download.csdn.net/download/qq_45697428/89440340
运行的结果:
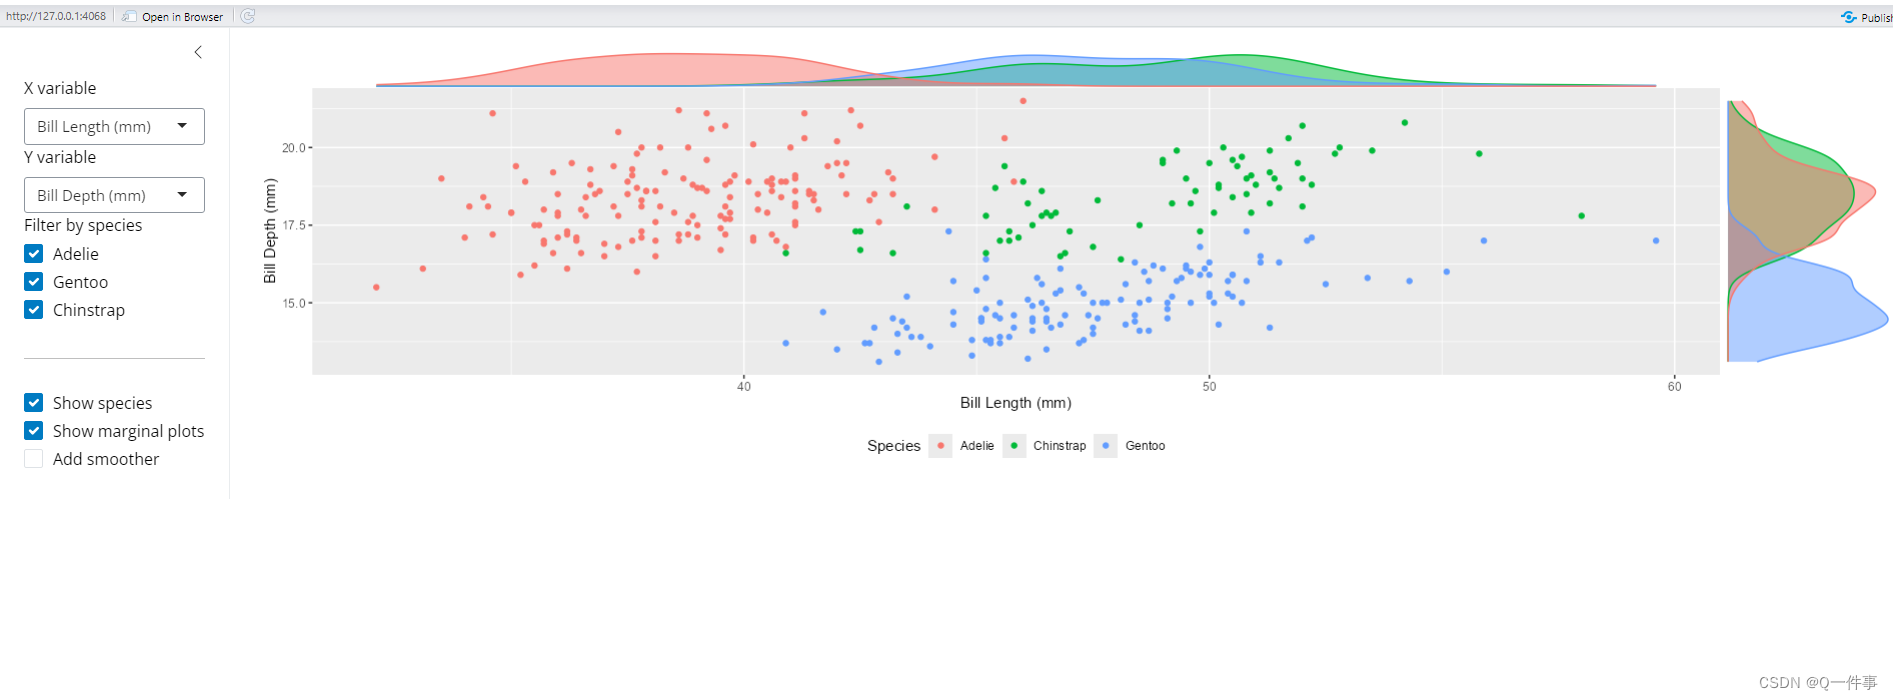
在这个框架下可以调整XY轴的内容


 5582
5582

 被折叠的 条评论
为什么被折叠?
被折叠的 条评论
为什么被折叠?
 到【灌水乐园】发言


