


 本文介绍了如何利用R语言的ggplot2包来创建带误差棒的柱状图。首先,通过`read.csv`函数读取数据,接着详细展示了制作带误差棒柱状图的代码过程,区别于折线图的`geom_line()`和`geom_point()`,柱状图使用`geom_bar()`函数。最后,展示了生成的柱状图运行结果。
1.读取数据。原始数据如表1,其地址为:C:\\Users\\26869\\Desktop\\柱状图.csv。开始前使用library()函数调出ggplot2()。然后用read.csv(C:\\Users\\26869\\Desktop\\柱状图.csv)读取原始数据(如图1)。
表1 原始数据表
| supp | does | len | SD | SE |
| OJ | 0.5 | 13.2 | 4.5 | 2.1 |
| OJ | 1 | 22.7 | 3.9 | 2 |
| OJ | 2 | 26.1 | 2.7 | 1.6 |
| VC | 0.5 | 8 | 2.8 | 1.7 |
| VC | 1 | 16.8 | 2.5 | 1.6 |
| VC | 2 | 26.1 | 4.8 | 2.2 |
library("ggplot2")
read.csv("C:\\Users\\26869\\Desktop\\柱状图.csv")
图1 读取原始数据代码
2.带误差棒的折线图制作。代码如图2:(柱状图和折线图的区别是一个使用的geom_bar()函数,另一个是使用geom_line()和geom_point()两个函数的组合使用。)
df2<-read.csv("C:\\Users\\26869\\Desktop\\柱状图.csv")
df2
ggplot(df2, aes(x=does, y=len, fill=supp)) +
  geom_bar(position=position_dodge(), stat="identity") +
  geom_errorbar(aes(ymin=len-SE, ymax=len+SE),size=0.75,width=0.08,position=position_dodge(0.45))+
  scale_y_continuous(breaks=0:20*4) +
  scale_x_continuous(breaks=0:10*0.5)+
  theme_bw()+
  theme(panel.grid.major=element_line(colour=NA),
          panel.background = element_rect(fill = "transparent",colour = NA),
          plot.background = element_rect(fill = "transparent",colour = NA),
          panel.grid.minor = element_blank(),legend.justification=c(0.85,0.1),legend.position=c(0.85,0.1))
  labs(x=NULL,y="长度",title=NULL)
图2 柱状图代码
3.运行结果如图3所示:
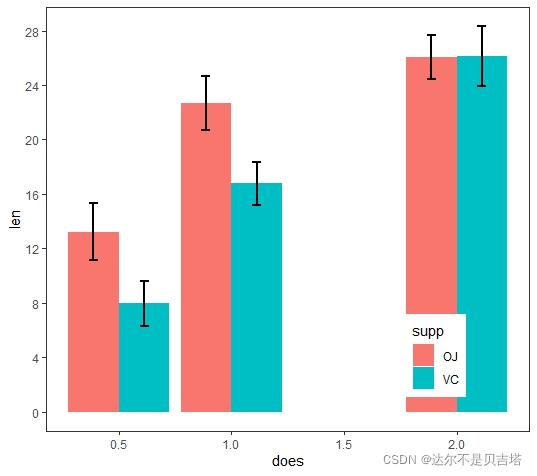
图3 运行结果图


 3315
3315

 被折叠的 条评论
为什么被折叠?
被折叠的 条评论
为什么被折叠?
 到【灌水乐园】发言


