


个人理解,有错欢迎评论留言!毕竟也不想误人子弟!哈哈哈!
基本原理
概要:
模拟固体加热时的粒子动能大的特定使得粒子的随机性变大,然后慢慢趋于静止的过程。
通过赋予搜索过程一种时变且最终趋于零的概率突跳性,从而可有效避免陷入局部极小并最终趋于全局最优的串行结构的优化算法。
模拟退火算法的精髓在于跳出局部最优时的突进和慢慢冷静!浅显理解:选择下一步的时候会选择对于当前来说不好的行为,刚开始选择不好的行为的概率较大(对应的温度高),随着时间的推移(冷却的过程),选择不好行为的概率会逐渐地减少,直至为零,从而求得最优解。
公式:
P
=
e
δ
E
/
T
P=e^{\delta E/T}
P=eδE/T
细节:
1,
δ
E
>
0
\delta E>0
δE>0 表明当前取其值较优,选择
2,若
δ
E
<
0
\delta E<0
δE<0 则计算:
P
=
e
δ
E
/
T
P=e^{\delta E/T}
P=eδE/T,根据概率p的值进行随机取舍,其中T为“温度”
代码实践
求解问题描述:
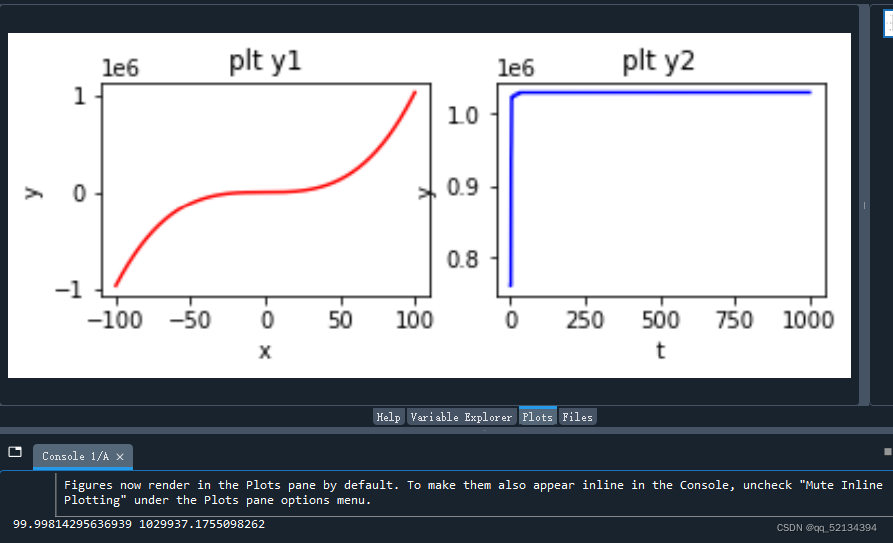
运用模拟退火算法求解函数
y
=
x
3
+
3
x
2
−
6
y=x^3+3x^2-6
y=x3+3x2−6的最大值
import numpy as np
import matplotlib.pyplot as plt
from matplotlib.image import imread
import math


# define aim function
def aimFunction(x):                    #定义解决的问题,求解最大值
    y = x ** 3 + 3 * x ** 2 - 6
    return y


x = [i / 10 for i in range(-1000, 1000)]  # the domain is [-100,100]
y = [0.0 for i in range(-1000, 1000)]
z1 = []
z2 = []

for i in range(2000):
    y[i] = aimFunction(x[i])
fig = plt.figure()
ax1 = fig.add_subplot(221)  #2*2的子图选择第一个
ax1.set_title('plt y1')
plt.xlabel('x')
plt.ylabel('y')
ax1.plot(x,y,c='r')           #画出求解的函数图像
# Seeking the maximum(minimum) of function
T = 1000  # initiate temperature
Tmin = 10  # final temperature                   温度的阈值
x = np.random.uniform(low=-100, high=100)  #  current state
k = 50  # cycle index under each T               每个温度下更新的次数
y = 0  # evaluation function
t = 0  # Used to control the speed of cooling    冷却速度的把控
while T >= Tmin:
    for i in range(k):
        # compute y
        y = aimFunction(x)
        # generate a new solution
        xNew = x + np.random.uniform(low=-0.055, high=0.055) * T        #这里是新点的建立,即用随机数来产生最初的下一步
        if (-100 <= xNew and xNew <= 100):
            yNew = aimFunction(xNew)
            if yNew - y > 0:  #if the new evaluation funciton is larger, accept the new solution,if the minimal is needed, change it to:  if yNew - y > 0:  #deltaE > 0,选择该下一步
                x = xNew
            else:
                # criterion of metropolis , get a new solution or perform a cooling
                p = math.exp((yNew - y) / T)  #Maximization, if the minimal is needed, change it to: p = math.exp(-(yNew - y) / T)
                r = np.random.uniform(low=0, high=1)     #引入一个随机概率阈值,来决定该不好行为的取舍
                if r < p:
                    x = xNew
    t += 1
  #  print(t)
    # anealing
    T = 10000 / (1 + t)         #温度的冷却
    z1.append(t)
    z2.append(y)
ax2 = fig.add_subplot(222)
ax2.set_title('plt y2')
plt.xlabel('t')
plt.ylabel('y')
ax2.plot(z1,z2,c='b')
plt.show()                  #画出冷却加速度与y值的关系

print(x, aimFunction(x))    #打印y最大值时对应的x和该最大值
结果展示:


 9862
9862


 被折叠的 条评论
为什么被折叠?
被折叠的 条评论
为什么被折叠?
 到【灌水乐园】发言


