


实现数据的直观展示
Matplotlib基本要点:
- 绘制图形:
import matplotlib.pyplot as plt
x = [2,4,6,8,10]
y = [18,22,33,21,25]

plt.plot(x,y)
plt.show()- 设置图片大小
调用figure方法可以实现对于图片的大小设置,还可以通过设置dpi参数实现对于图片清晰度的调整。
- 保存到本地
调用savefig方法实现图片的保存,传入参数为保存路径,保存为svg矢量图可以在图片放大后不出现锯齿
- 调整X或Y轴刻度间距
通过xticks和yticks方法可以对坐标轴的刻度进行调整。
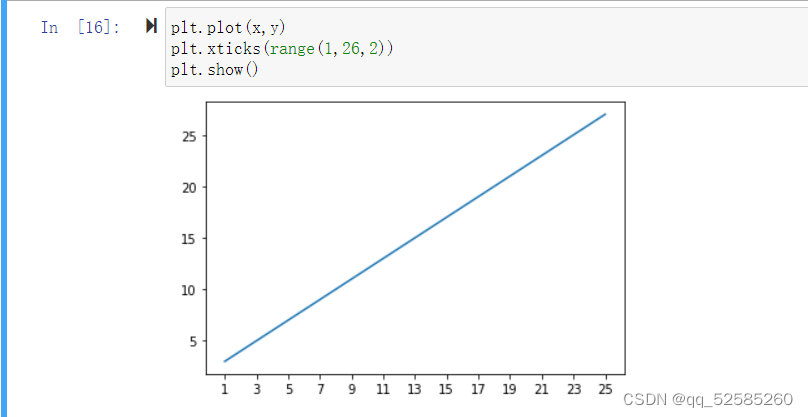
让x轴显示字符串的方法: plt.xticks()方法
可以向plt.xticks()中传入两个参数,第一个参数是数值参数,第二个参数是字符串参数,两者的长度相同,从而可以一一对应。
原图:
x = [i for i in range(0,120)]
y = [random.randint(22,35) for i in raneg(0,120)]
plt.figure(figsize=(20,8))
plt.plot(x,y)
plt.show() 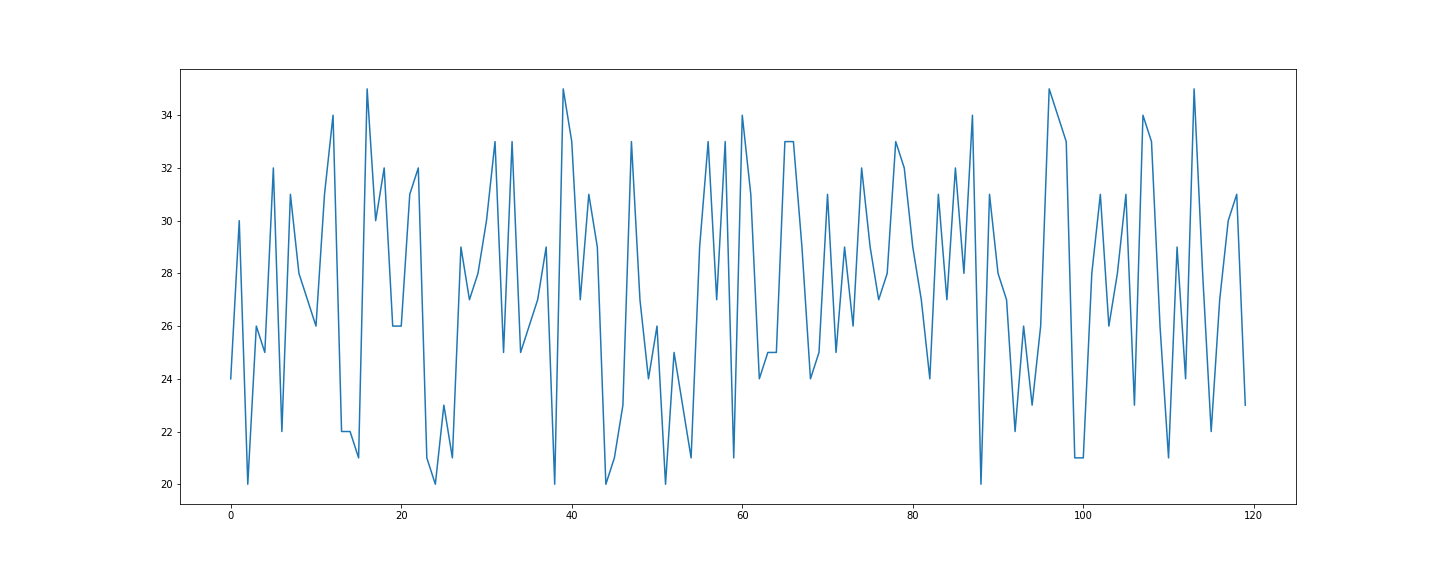
对x轴进行参数设置后:
x = [i for i in range(0,120)]
y = [random.randint(22,35) for i in range(0,120)]
_x = x[::10]
x_labels = ["hello,{}".format(i) for i in _x]
plt.figure(figsize=(20,8))
plt.plot(x,y)
plt.xticks(_x,x_labels)
plt.show() 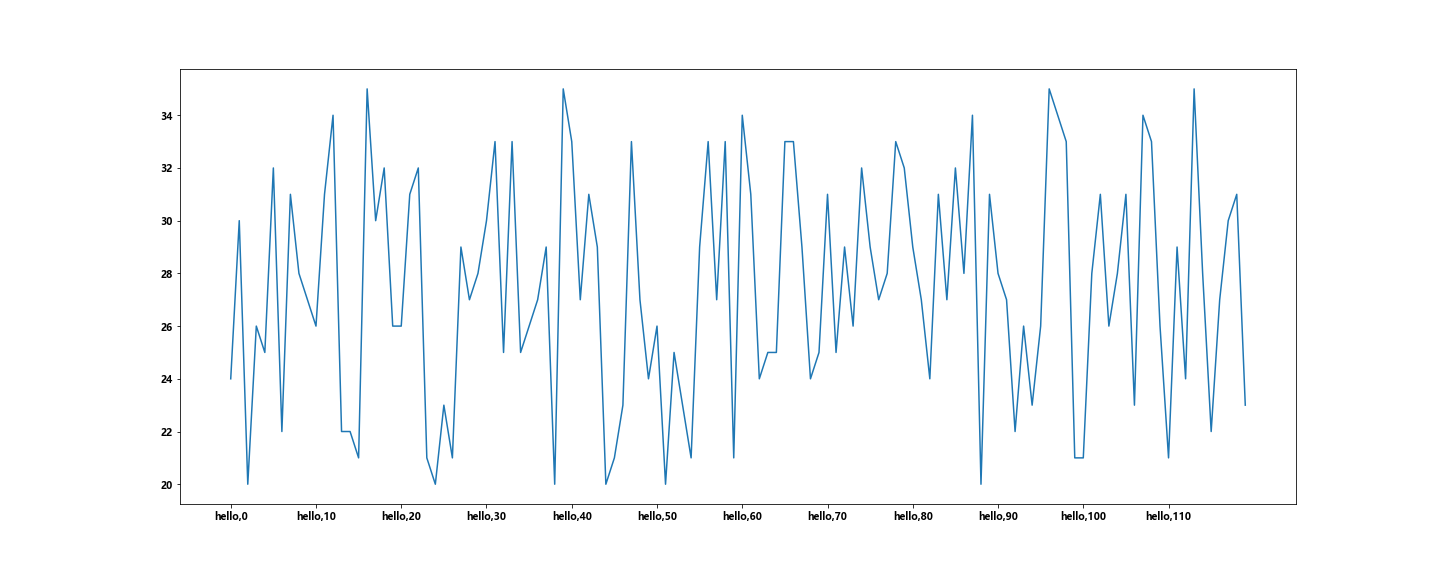
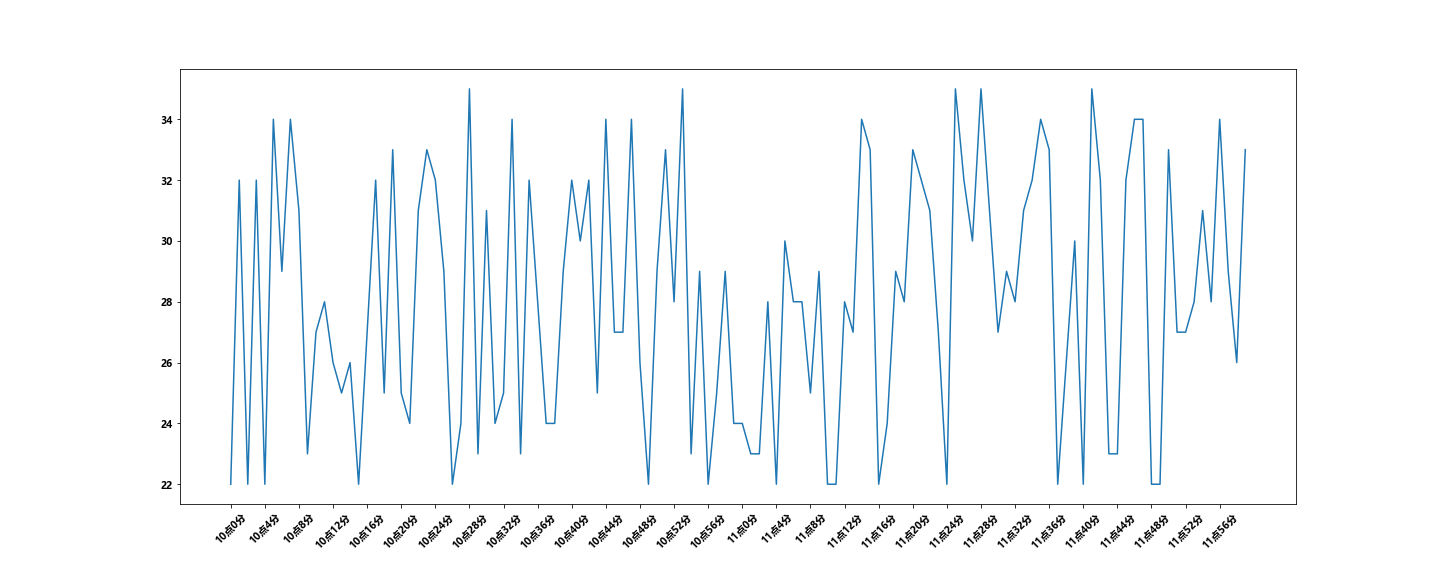
**坐标旋转与中文显示的问题
- 第一种方法:可以通过设置matplotlib.rc的方法解决
import matplotlib

##设置字体格式
font = {
    'family':'MicroSoft YaHei',
    'weight':'bold',
}
matplotlib.rc("font",**font)

x = [i for i in range(0,120)]
y = [random.randint(22,35) for i in range(0,120)]
_x = x
x_labels = ["10点{}分".format(i) for i in range(60)]
x_labels += ["11点{}分".format(i) for i in range(60)]
plt.figure(figsize=(20,8))
plt.plot(x,y)
plt.xticks(_x[::4],x_labels[::4],rotation=45)
效果:
- 第二种方法:设置matplotlib.font_manager中的Fontproperties
- 如果使用Fontproperties中的fname参数,需要传入的是相关字体的系统路径,可以在cmd中通过fc-list :lang=zh的方法查找中文字体(.ttc文件)
from matploylib import font_manager
my_font = font_manager.FontProperties(family='MicroSoft YaHei')

plt.plot(x,y)
plt.xticks(_x, x_labels, fontproperties = my_font)- 描述图片信息
##绘图的方法
plt.plot(x,x_label,label="",color="",linestyle="")
##调用多次可以实现在一个图上的多个图形绘制

##x轴标题
plt.xlabel()

##y轴标题
plt.ylabel()

##图片标题
plt.title()

##给图片添加网格,alpha设置网格的透明度,越小越透明
plt.grid(alpha=0.4,linestyle="")

##添加图例,需要在plt.plot()中添加label参数,prop参数设置字体,loc设置图例位置
plt.legend(prop=my_font,loc="")
同样需要注意中文字体的问题,方法同上。
- 线条的样式
- 标记出特殊的点
- 给图片添加水印


 3522
3522


 被折叠的 条评论
为什么被折叠?
被折叠的 条评论
为什么被折叠?
 到【灌水乐园】发言


