


目录
1.Pandas介绍
2008年WesMcKinney开发出的库
专门用于数据挖掘的开源python库
以Numpy为基础,借力Numpy模块在计算方面性能高的优势
基于matplotlib,能够简便的画图
独特的数据结构
2.Pandas数据结构
Pandas中一共有三种数据结构,分别为:Series、DataFrame和MultiIndex(老版本中叫Panel )。
Series:一维数据结构
DataFrame:二维的表格型数据结构
MultiIndex:三维的数据结构
2.1Series
Series是一个类似于一维数组的数据结构,它能够保存任何类型的数据,比如整数、字符串、浮点数等,主要由一组数据和与之相关的索引两部分构成。

2.1.1 Series的创建
# 导入pandas
import pandas as pd

pd.Series(data=None, index=None, dtype=None)
参数:
data:传入的数据,可以是ndarray、list等
index:索引,必须是唯一的,且与数据的长度相等。如果没有传入索引参数,则默认会自动创建一个从0-N的整数索引。
dtype:数据的类型
通过已有数据创建
指定内容,默认索引
pd.Series(np.arange(10))

# 运行结果
0    0
1    1
2    2
3    3
4    4
5    5
6    6
7    7
8    8
9    9
dtype: int64
指定索引
pd.Series([6.7,5.6,3,10,2], index=[1,2,3,4,5])

# 运行结果
1     6.7
2     5.6
3     3.0
4    10.0
5     2.0
dtype: float64
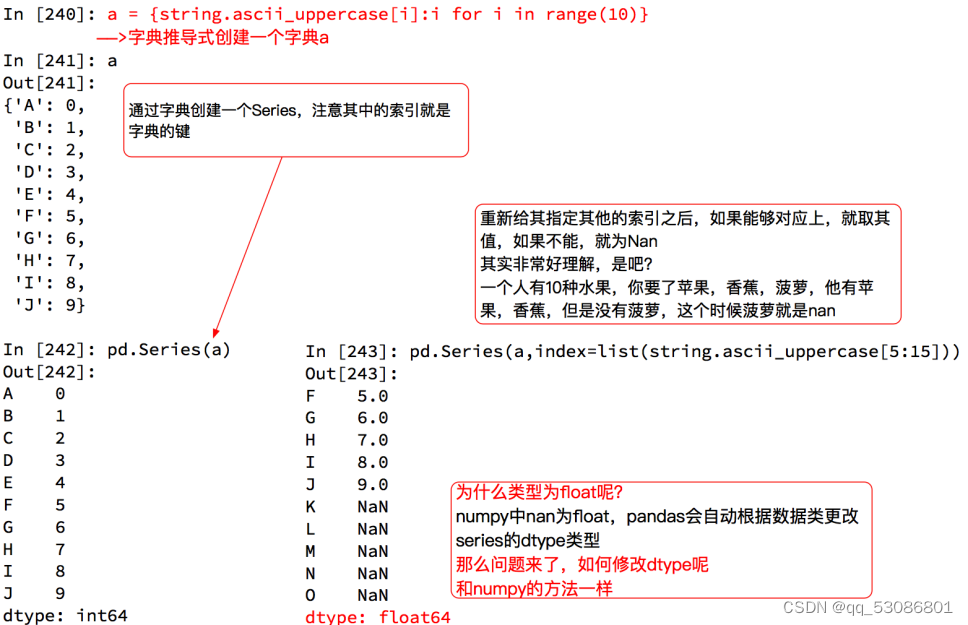
通过字典数据创建(key=index)
color_count = pd.Series({'red':100, 'blue':200, 'green': 500, 'yellow':1000})
color_count

# 运行结果
blue       200
green      500
red        100
yellow    1000
dtype: int64
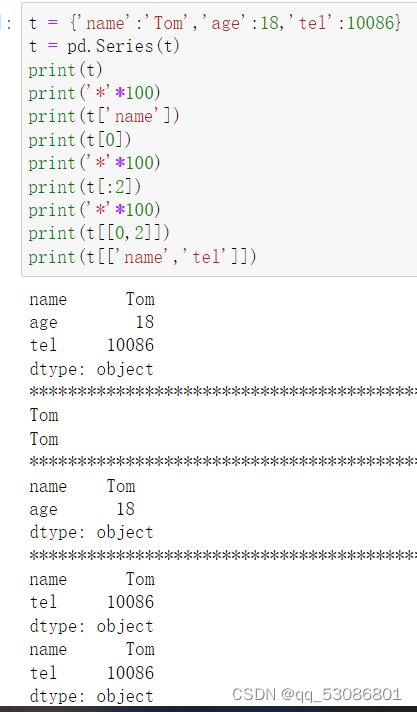
2.1.2Series切片和索引
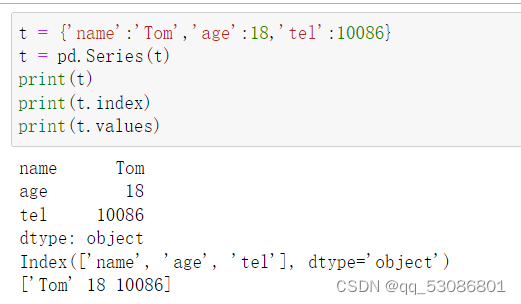
2.1.3Series的属性
为了更方便地操作Series对象中的索引和数据,Series中提供了两个属性index和values
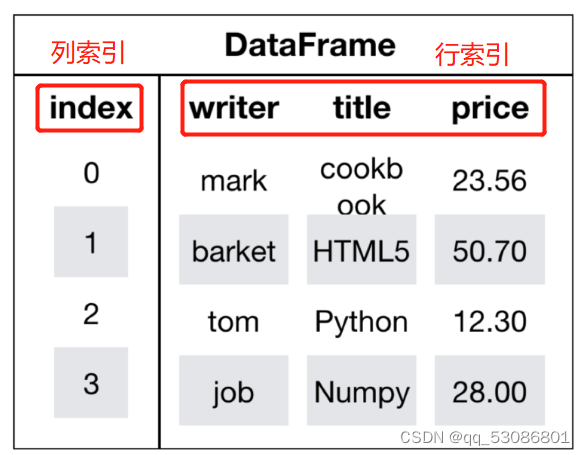
2.2DataFrame
DataFrame是一个类似于二维数组或表格(如excel)的对象,既有行索引,又有列索引
行索引,表明不同行,横向索引,叫index,0轴,axis=0
列索引,表名不同列,纵向索引,叫columns,1轴,axis=1
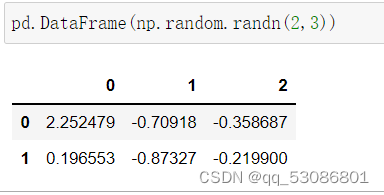
2.2.1DataFrame的创建
# 导入pandas
import pandas as pd

pd.DataFrame(data=None, index=None, columns=None)
参数:
index:行标签。如果没有传入索引参数,则默认会自动创建一个从0-N的整数索引。
columns:列标签。如果没有传入索引参数,则默认会自动创建一个从0-N的整数索引。
通过已有数据创建

以某列值设置为新的索引
set_index(keys, drop=True)
keys : 列索引名成或者列索引名称的列表
drop : boolean, default True.当做新的索引,删除原来的列
df = pd.DataFrame({'month': [1, 4, 7, 10],
                    'year': [2012, 2014, 2013, 2014],
                    'sale':[55, 40, 84, 31]})
'''
   month  sale  year
0  1      55    2012
1  4      40    2014
2  7      84    2013
3  10     31    2014
'''

#以月份设置新的索引

df.set_index('month')
'''
       sale  year
month
1      55    2012
4      40    2014
7      84    2013
10     31    2014
'''
2.2.2取行或者列
df.loc 通过标签索引行数据

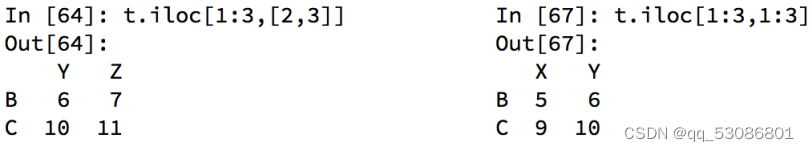
df.iloc 通过位置获取行数据
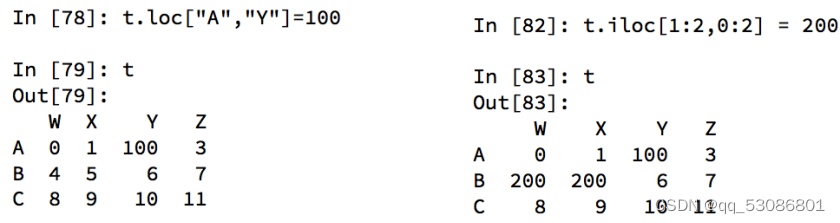
赋值更改数据
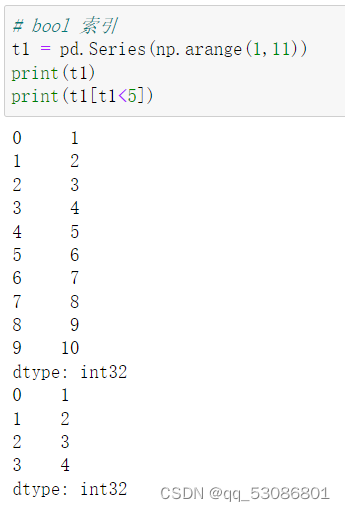
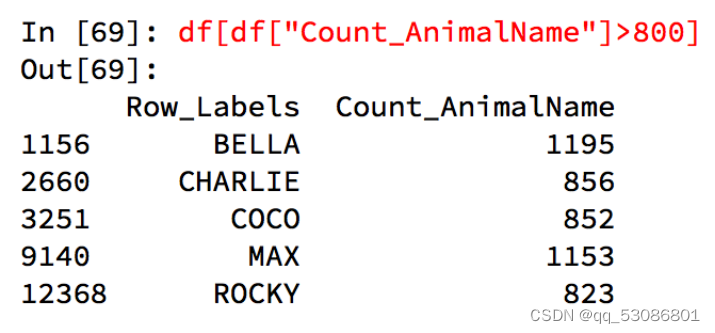
布尔索引
有两个条件时:
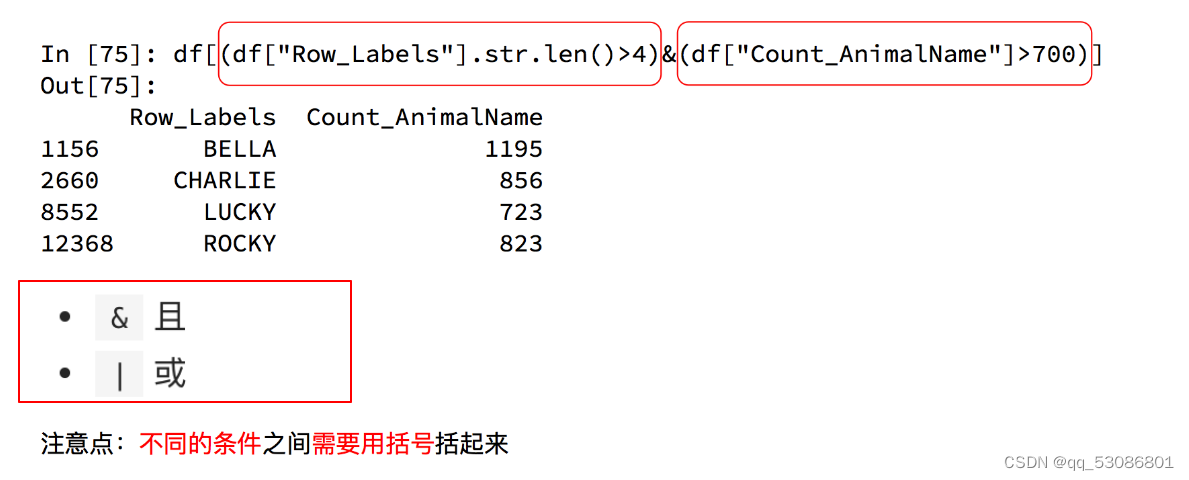
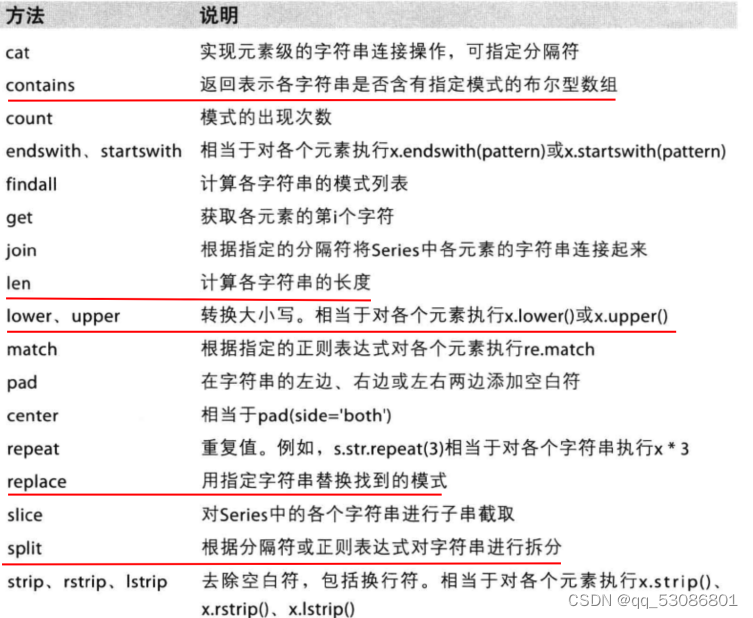
字符串方法
3.pandas读取外部数据
数据大部分存在于文件当中,所以pandas会支持复杂的IO操作,pandas的API支持众多的文件格式,如CSV、SQL、XLS、JSON、HDF5
read_csv
pandas.read_csv(filepath_or_buffer, sep =',', usecols )
filepath_or_buffer:文件路径
sep :分隔符,默认用","隔开
usecols:指定读取的列名,列表形式
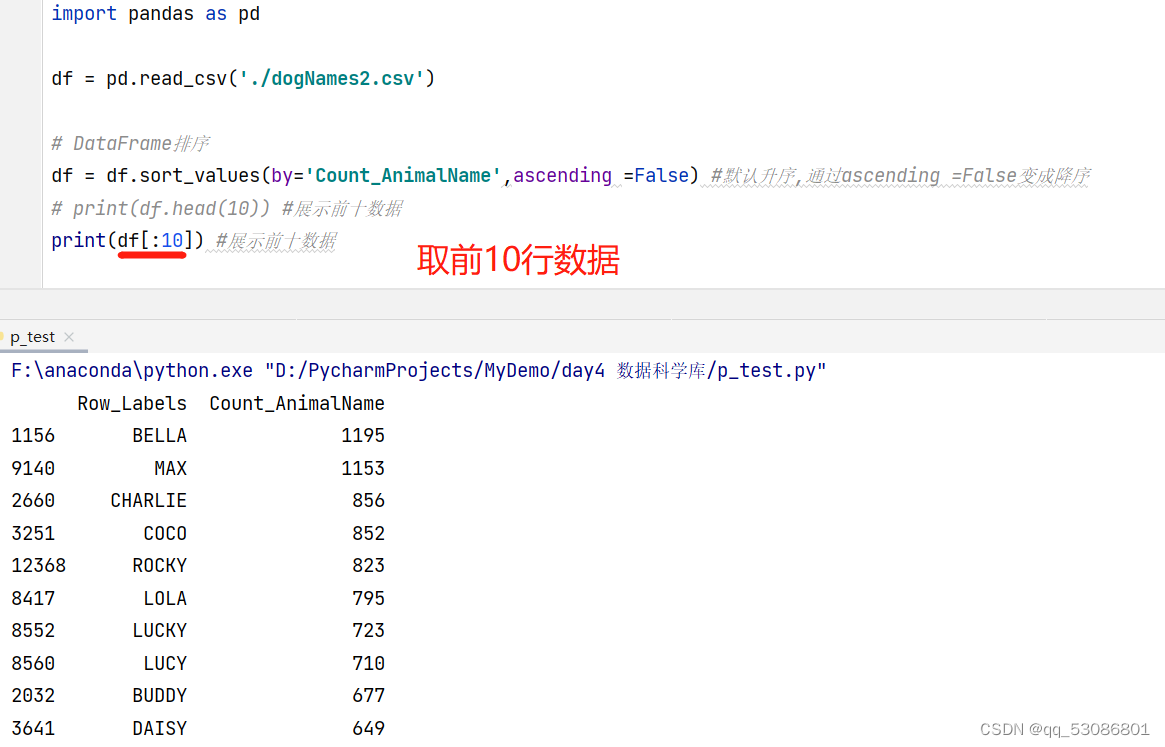
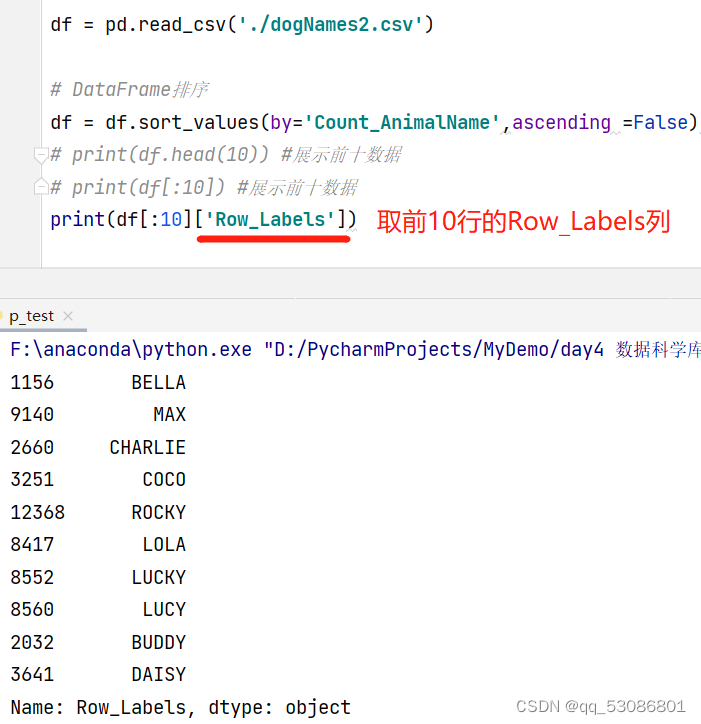
次数最高的前几个名字
df.sort_values(by=“Count_AnimalName”,ascending=False)排序
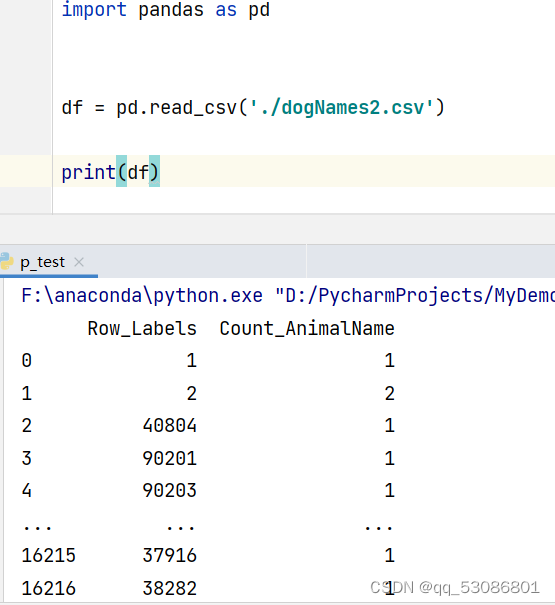
import pandas as pd

df = pd.read_csv('./dogNames2.csv')

# DataFrame排序
df = df.sort_values(by='Count_AnimalName',ascending =False) #默认升序,通过ascending =False变成降序
print(df.head(10)) #展示前十数据

# 输出结果
  Row_Labels  Count_AnimalName
1156       BELLA              1195
9140         MAX              1153
2660     CHARLIE               856
3251        COCO               852
12368      ROCKY               823
8417        LOLA               795
8552       LUCKY               723
8560        LUCY               710
2032       BUDDY               677
3641       DAISY               649
4.缺失数据的处理
4.1处理nan
判断数据中是否包含NaN:
pd.isnull(df),
pd.notnull(df)
1、删除存在缺失值的:dropna(axis=‘rows’,how=‘any’/‘all’)
axis=0:行
axis=1:列
how=‘any’ :只要含有nan就删除
how=‘all’ :全nan才删除
注:不会修改原数据,需要接受返回值
2、替换缺失值:fillna(value, inplace=True)
value:替换成的值
inplace:True:会修改原数据,False:不替换修改原数据,生成新的对象
pandas中进行求均值等操作时nan不会参与运算,因此可以直接以均值填充nan
t.fillna(t.mean()) 填充为均值
t.fiallna(t.median()) 填充为中值
t.fillna(0) 填充为0


 1355
1355


 被折叠的 条评论
为什么被折叠?
被折叠的 条评论
为什么被折叠?
 到【灌水乐园】发言


