


目录
一维插值是数据分析重要方法,有基于多项式的插值,和基于快速傅里叶的插值
直接上代码:
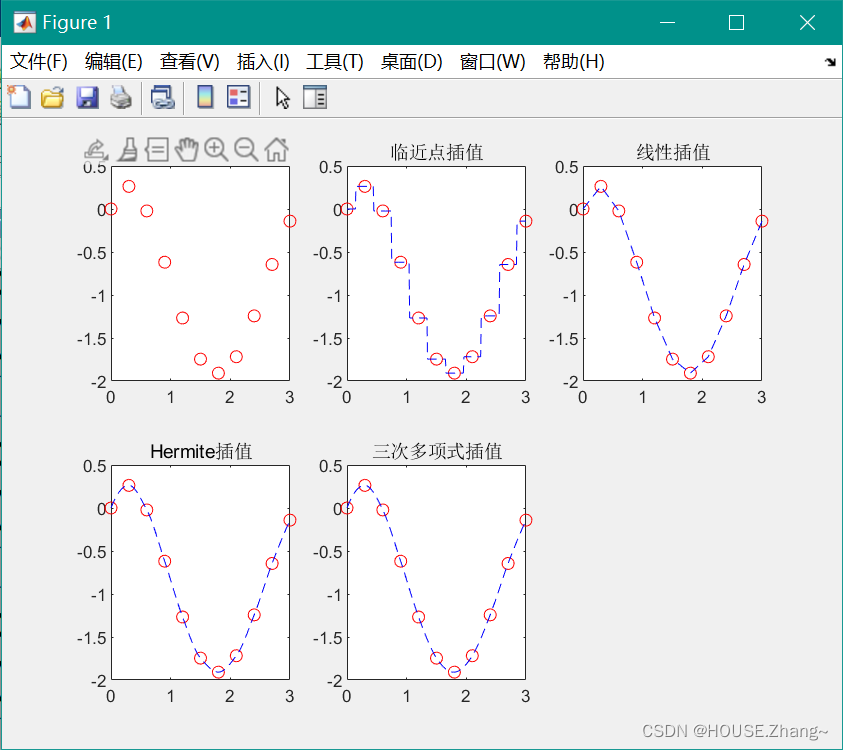
一维插值
clear all
clc
x=0:0.3:3;
y=(x.^2-4*x+2).*sin(x);
xi=0:0.01:3;
yi_nearest=interp1(x,y,xi,'nearest');
yi_linear=interp1(x,y,xi);
%yi_spine=interp1(x,y,xi,'spine');
yi_pchip=interp1(x,y,xi,'pchip');
yi_v5cubic=interp1(x,y,xi,'v5cubic');
figure;
hold on;
subplot(231);
plot(x,y,'ro');
title('画点');
subplot(232);
plot(x,y,'ro',xi,yi_nearest,'b--');
title('临近点插值');
subplot(233);
plot(x,y,'ro',xi,yi_linear,'b--');
title('线性插值');
subplot(234);
plot(x,y,'ro',xi,yi_pchip,'b--');
title('Hermite插值');
subplot(235);
plot(x,y,'ro',xi,yi_v5cubic,'b--');
title('三次多项式插值');
效果就是这样:
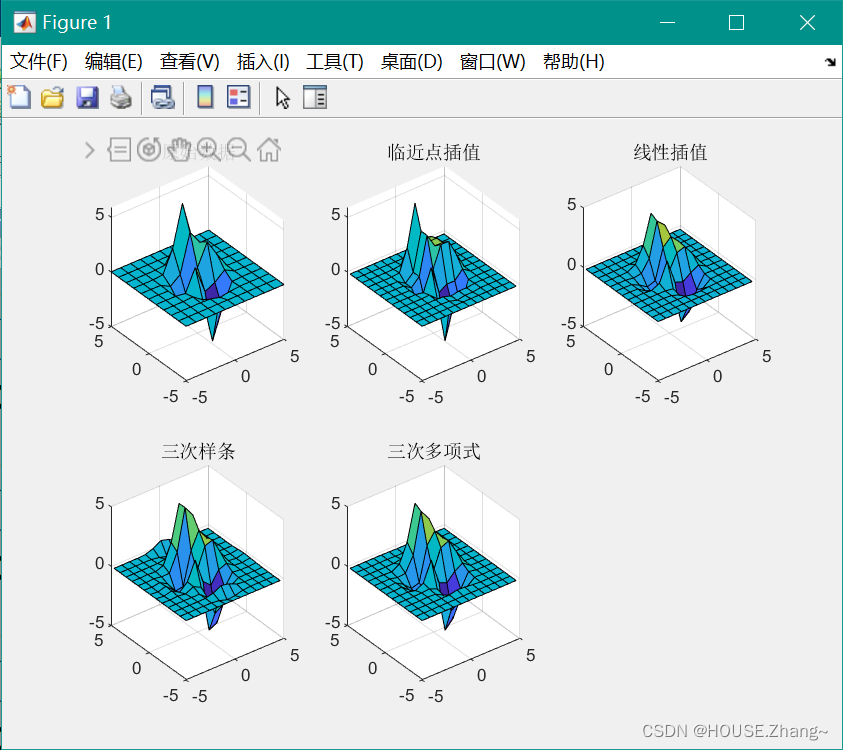
二维插值:
clear all
clc
[x,y]=meshgrid(-5:1:5);
z = peaks(x,y);
[xi,yi]=meshgrid(-5:0.8:5);
zi_nearest=interp2(x,y,z,xi,yi,'nearest');
zi_linear=interp2(x,y,z,xi,yi);
zi_spline=interp2(x,y,z,xi,yi,'spline');
zi_cubic=interp2(x,y,z,xi,yi,'cubic');
figure;
hold on;
subplot(231);
surf(x,y,z);
title('原始数据');
subplot(232);
surf(xi,yi,zi_nearest);
title('临近点插值');
subplot(233);
surf(xi,yi,zi_linear);
title('线性插值');
subplot(234);
surf(xi,yi,zi_spline);
title('三次样条');
subplot(235);
surf(xi,yi,zi_cubic);
title('三次多项式');
样条插值:
clear all
clc
x=[0 2 4 5 8 12 12.8 17.2 19.9 20];
y=exp(x).*sin(x);
xx=0:0.25:20;
yy=spline(x,y,xx);
plot(x,y,'o',xx,yy)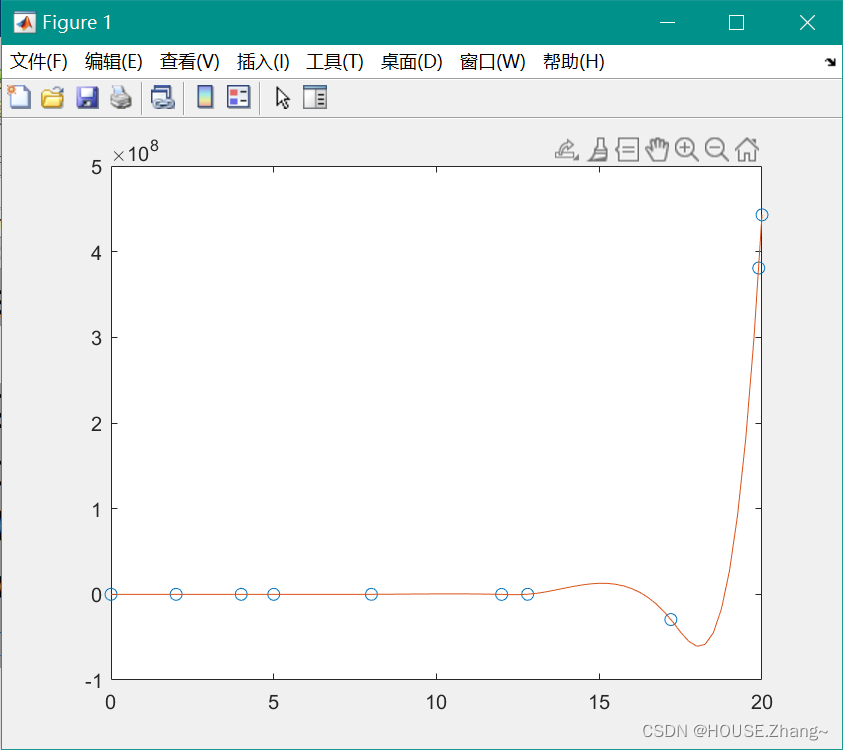


 1920
1920


 被折叠的 条评论
为什么被折叠?
被折叠的 条评论
为什么被折叠?
 到【灌水乐园】发言


