


一、绘图技术
1.SVG矢量图:就是用标签代码画图 不是用像素来描绘的矩阵图像
是一种可伸缩的矢量图型,它基于XML并用于描述图形的语言
2.canvas:画布 是H5出的技术 用js来画图
3.与图片image的区别:
canvas和SVG都是代码 网络传输快 在大多数广告中使用
img是图片编码 网络传输慢
二、canvas认识
- canvas元素自己就是图片 有自己的编码宽高 不设置就默认是300x150
- 通过属性设置canvas本身编码宽高 css设置渲染的宽高
- 一般父元素宽高多大就设置canvas的编码宽高多大 避免失真
- 建议不要设置css样式的宽高 直接改编码宽高或者父盒子宽高
- 画布的'getContext()'方法返回一个“绘制上下文”对象 绝大多数的画布绘制API来自这个对象
- 也就是说画布元素和他的上下文对象是两个完全不同的概念
- 调用该方法时 传递的参数是“2d”,也就是`getContext('2d')` 代表可以在画布上绘制二维图像
- canvas可以用于 双屏互动 大数据页面 柱状图 游戏 ...等等
三、画布的尺寸和坐标
- 画布以左上角(0, 0)为坐标原点
- 往右为X轴的坐标不断增大
- 往下为Y轴的坐标不断增大
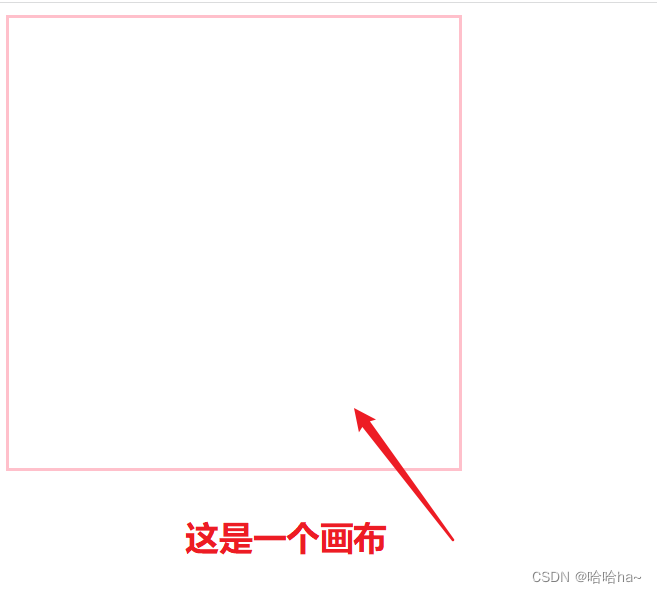
示例(一个简单的画布):
<style>
    #box {
            border: 2px pink solid;
    }
</style>
<canvas id="box" width="300px" height="300px">这是一个画布</canvas>
<script>
        var canvas = document.querySelector("#box")
        var pen = canvas.getContext("2d")
</script>
效果图:
四、绘制线条
1)说明:
绘制线段的API是上下文对象的方法
beginPath:开始定义一条新的路径
moveTo:开始定义一条新的子路径 该方法确定了线段的起点
lineTo:将上面定义的线段起点和指定的新的点连接起来
fill():填充区域 此时只是填 起点和终点并没有连接起来
closePath:会把起点和终点连接起来
stroke():开始绘制图形,当前路径下的所有子路经都会绘制出来
如果要接着绘制新的路径,需要重新调用beginPath()方法
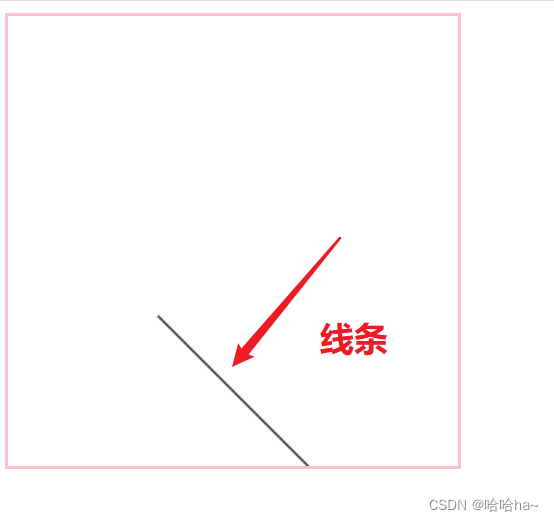
2) 示例(一根线条):
<style>
    #box {
            border: 2px pink solid;
    }
</style>
<canvas id="box" width="300px" height="300px">这是一个画布</canvas>
<script>
        var canvas = document.querySelector("#box")
        var pen = canvas.getContext("2d")
        pen.moveTo(100, 200)
        pen.lineTo(200, 300)
        pen.stroke()
 </script>
效果图:
3)示例(三角形):
<style>
    #box {
            border: 2px pink solid;
    }
</style>
<canvas id="box" width="600px" height="600px">这是一个画布</canvas>
<script>
        var canvas = document.querySelector("#box")
        var ctx = canvas.getContext("2d") //获取上下文-代码
        ctx.lineWidth = 5 //线条的粗细
        ctx.strokeStyle = "blue" //线条的颜色
        //线条(三角形)
        ctx.moveTo(100, 100)
        ctx.lineTo(300, 300) //第一条线
        ctx.moveTo(400, 100)
        ctx.lineTo(100, 100) //第二条线
        ctx.moveTo(400, 100)
        ctx.lineTo(300, 300) //第三条线
        //绘画
        ctx.stroke()
</script>
效果图:

4)示例(折线心电图):
<style>
    #box {
            border: 2px pink solid;
    }
</style>
<script>
<canvas id="box" width="600px" height="600px">这是一个画布</canvas>
var canvas = document.querySelector("#box")
var ctx = canvas.getContext("2d")
//开启一条新(格子)轨迹
ctx.beginPath()
var m = 10
for (var i = 0; i < parseInt(600 / m); i++) {
ctx.moveTo(0, i * m)
ctx.lineTo(600, i * m)
ctx.moveTo(i * m, 0)
ctx.lineTo(i * m, 600)
}
ctx.stroke()

//开启另外一条新的(坐标轴)轨迹
ctx.beginPath()
ctx.lineWidth = 4
ctx.strokeStyle = "black"
ctx.moveTo(50, 50)
ctx.lineTo(50, 500)
ctx.lineTo(500, 500)
ctx.lineTo(480, 510)
ctx.moveTo(500, 500)
ctx.lineTo(480, 490)
ctx.moveTo(50, 50)
ctx.lineTo(60, 80)
ctx.moveTo(50, 50)
ctx.lineTo(40, 80)
ctx.stroke()

//开启心跳的轨迹
arr = [30, 60, 50, 90, 64, 80, 68, 99, 50, 65, 82]
setInterval(() => {
    arr.push(Math.random() * (120 - 50) + 50)
}, 1000)
setInterval(draw, 300)
function draw() {
         ctx.beginPath()
         ctx.lineWidth = 2
         ctx.strokeStyle = "red"
         for (let i = 0; i < arr.length; i++) {
                ctx.lineTo(i * 30 + 60, 400 - arr[i])
            }
         ctx.stroke()
 }
</script>
效果图:

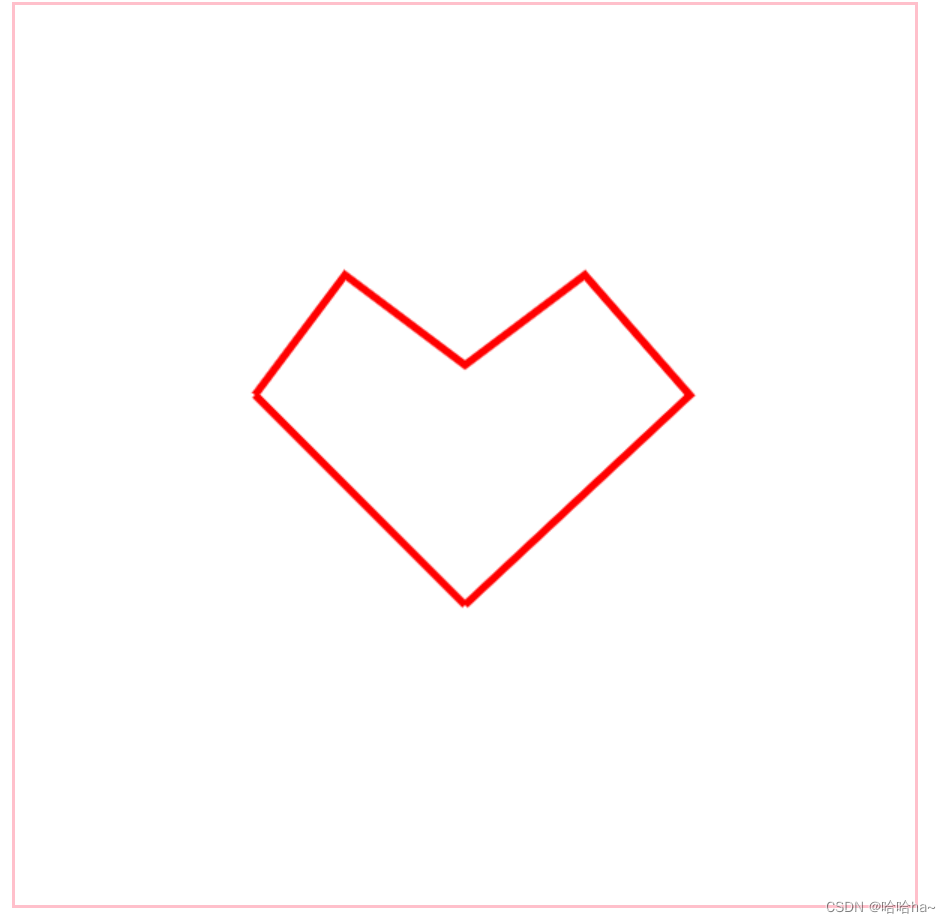
5)示例(爱心图形):
<style>
    #box {
            border: 2px pink solid;
    }
</style>
<canvas id="box" width="600px" height="600px"> 这是一个画布</canvas>
<script>
        var canvas = document.querySelector("#box")
        var l = canvas1.getContext("2d")
        l.beginPath() //开启一条新的轨迹
        l.lineWidth = 5
        l.strokeStyle = "red"
        //绘制线条
        l.moveTo(160, 260)
        l.lineTo(220, 180)
        l.lineTo(300, 240)
        l.lineTo(380, 180)
        l.lineTo(450, 260)
        l.lineTo(300, 400)
        l.moveTo(300, 400)
        l.lineTo(160, 260)
        //绘制心形图形
        l.stroke()
</script>
效果图:
五、绘制矩形
1)说明:
rect():在当前子路经添加一条弧线
- 语法:context.rect(x,y,width,height)
- 参数: 起点坐标x,y:左上角坐标; 宽度width:矩形的宽度; 高度height:矩形的高度
strokeRect():可以直接绘制一个矩形
- 语法:context.strokeRect(x,y,width,height)
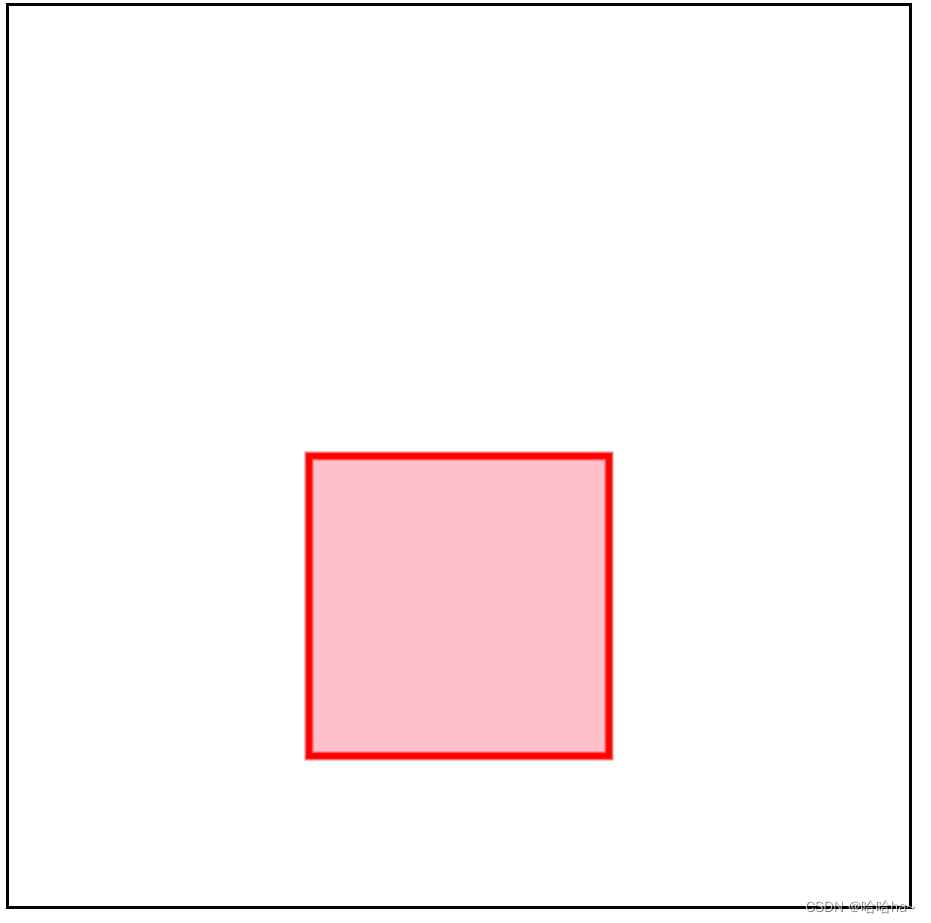
2) 示例(绘制矩形框):
<style>
#box {
border: 2px black solid;
}
</style>
<canvas id="box" width="600px" height="600px">画布</canvas>
<script>
var canvas = document.querySelector("#box")
var ctx = canvas.getContext("2d")
//1.用线条绘制矩形框
ctx.moveTo(200,300)
ctx.lineTo(200,500)
ctx.lineTo(400,500)
ctx.lineTo(400,300)
ctx.lineWidth=5
ctx.strokeStyle="red" //绘制线条的颜色
ctx.fillStyle="pink" //闭合区域的颜色
ctx.fill()//闭合图形填充颜色 默认黑色
ctx.closePath()
ctx.stroke()
//2.直接绘制矩形框
ctx.rect(200,100,300,400)
ctx.fillStyle="black"
ctx.fill()
ctx.stroke()
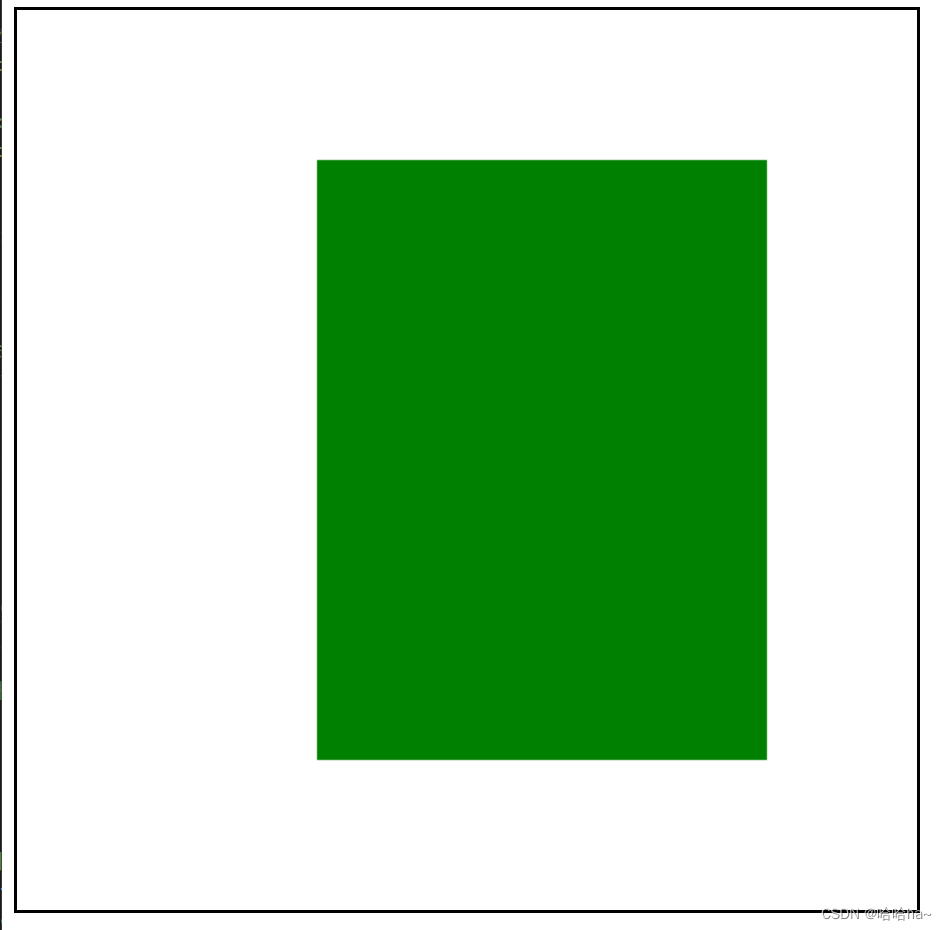
//3.直接绘制带颜色的矩形框
ctx.fillStyle="green"
ctx.fillRect(200,100,300,400)
ctx.stroke()
//以上任选一种绘制矩形
</script>效果图:

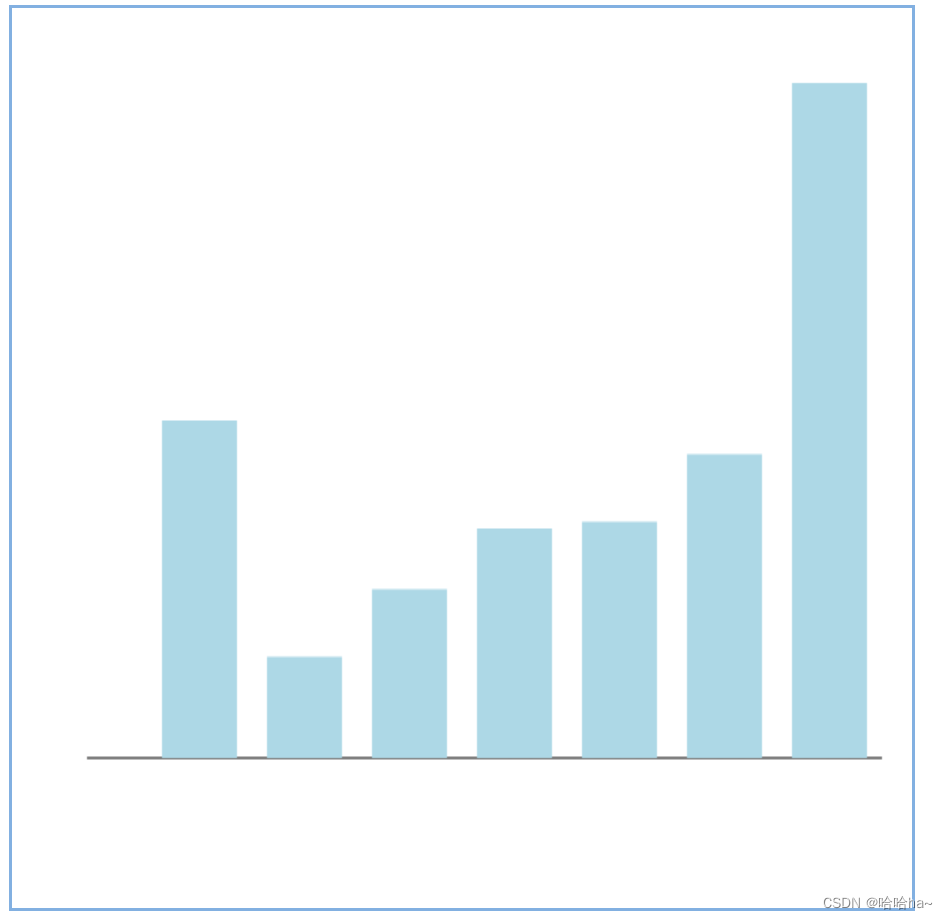
3)示例(柱状图):
<style>
       #box1 {
            border: 2px rgb(130, 176, 225) solid;
        }
</style>
<canvas id="box1" width="600px" height="600px">柱状图</canvas>
    <script>
        var canvas1 = document.querySelector("#box1")
        var ctx1 = canvas1.getContext("2d")
        var arr=[1000,300,500,680,700,900,2000]
        ctx1.lineWidth = 1
        ctx1.lineTo(50, 500)
        ctx1.lineTo(580, 500)
        ctx1.stroke()

        let h=450/2000
        for(i=0;i<arr.length;i++){
            ctx1.beginPath()
            ctx1.fillStyle = "lightblue"
            ctx1.fillRect(100+i*70,500-h*arr[i], 50, h*arr[i])
        }
</script>
效果图:
六、绘制弧线
1)说明:
arc():在当前子路经添加一条弧线
语法:context.arc(x,y,r,sAngle,eAngle,counterclockwise);
参数 描述 x 圆的中心的 x 坐标 y 圆的中心的 y 坐标 r 圆的半径 sAngle 起始角 以弧度计(弧的圆形的三点钟位置是 0 度) eAngle 结束角 以弧度计 counterclockwise 可选 规定绘图方向 False = 顺时针 true = 逆时针
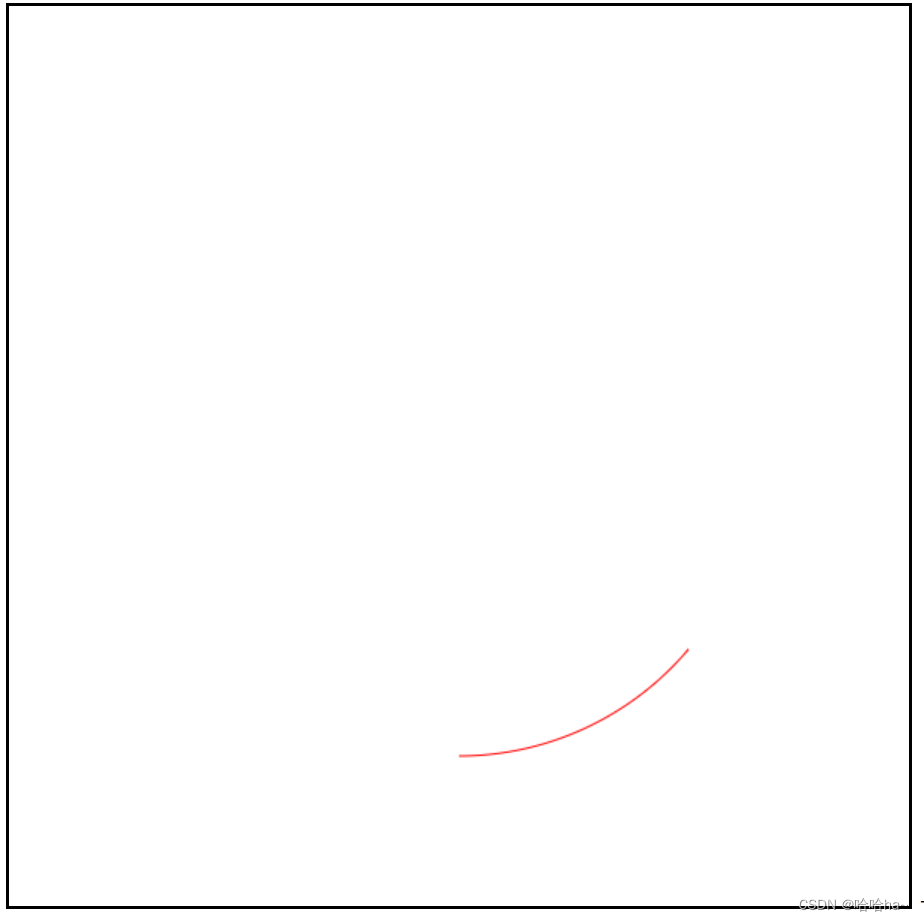
2)示例(一条弧线):
<style>
        #box {
            border: 2px black solid;
        }
</style>
<canvas id="box" width="600px" height="600px">画布</canvas>
<script>
        var canvas = document.querySelector("#box")
        var ctx = canvas.getContext("2d")
        //用线条绘制
        let deg = Math.PI / 180  //单位度数
        ctx.arc(300, 300, 200, 40 * deg, 90* deg)
                  //x       y      r     startdeg  endedg  position
        ctx.strokeStyle = "red"
        ctx.stroke()
</script>
效果图:
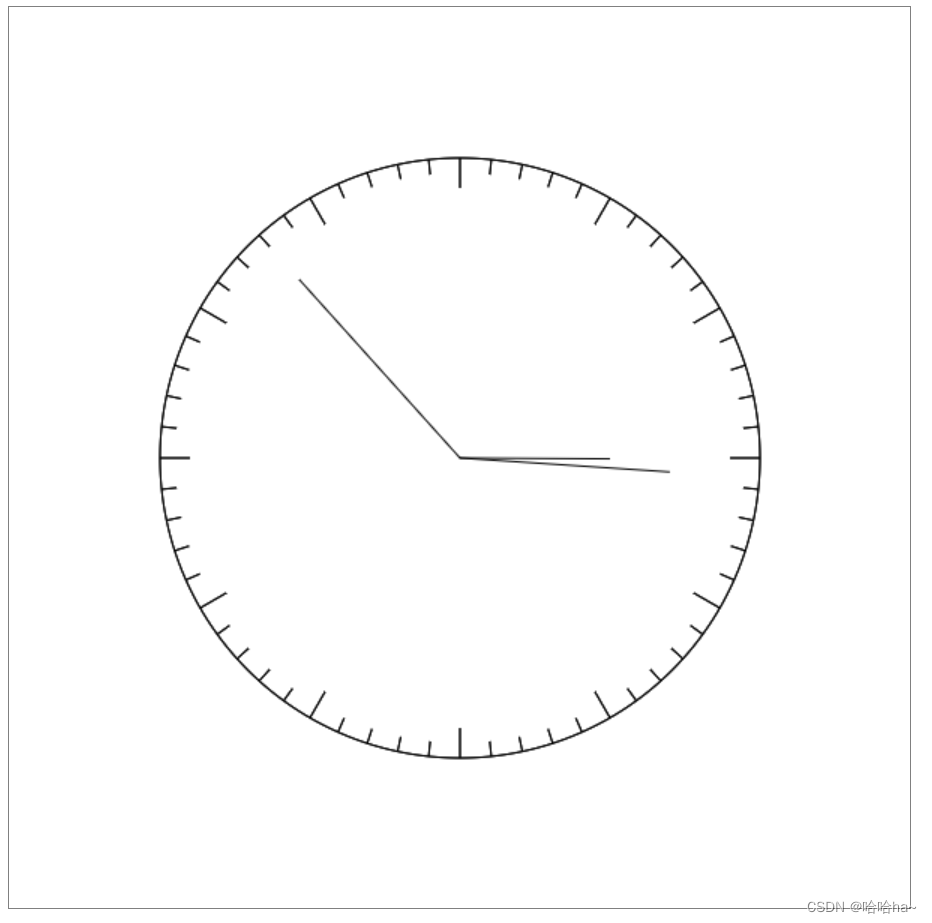
3)示例(时钟):
<style>
    #box1 {
            border: 2px rgb(130, 176, 225) solid;
       }
</style>
<canvas id="box1" width="600px" height="600px">时钟</canvas>
<script>
        var canvas1 = document.querySelector("#box1")
        var ctx1 = canvas1.getContext("2d")
        var deg1 = Math.PI / 180 //单位度数
        function biaopan() {
            var r = 200
            var x1 = 300
            var y1 = 300
            var kedu = 10
            ctx1.arc(x1, y1, r, 0, 360 * deg1)
            var n = 6
            for (let i = 0; i < 60; i++) {
                let a;
                if (i % 5) {
                    a = kedu
                } else {
                    a = kedu * 2
                }
                var y2 = y1 + r * Math.sin(i * n * deg1)
                var x2 = x1 + r * Math.cos(i * n * deg1)
                var y3 = y1 + (r - a) * Math.sin(i * n * deg1)
                var x3 = x1 + (r - a) * Math.cos(i * n * deg1)
                ctx1.moveTo(x2, y2)
                ctx1.lineTo(x3, y3)
            }
            ctx1.stroke()
        }

        function zhen() {
            var sh = 160
            var s = new Date().getSeconds()
            var hh = 100
            var hm = 140
            //秒针
            ctx1.moveTo(300, 300)
            var y4 = 300 + sh * Math.sin(s * 6 * deg1)
            var x4 = 300 + sh * Math.cos(s * 6 * deg1)
            ctx1.lineTo(x4, y4)
            //时针
            ctx1.moveTo(300, 300)
            var y5 = 300 + hh * Math.sin(s * 0.5 / 60 * deg1)
            var x5 = 300 + hh * Math.cos(s * 0.5 / 60 * deg1)
            ctx1.lineTo(x5, y5)
            //分钟
            ctx1.moveTo(300, 300)
            var y6 = 300 + hm * Math.sin(s * 0.1 * deg1)
            var x6 = 300 + hm * Math.cos(s * 0.1 * deg1)
            ctx1.lineTo(x6, y6)

            ctx1.stroke()

        }
        setInterval(() => {
            canvas1.width = canvas.width
            biaopan()
            zhen()
        }, 1000)
</script>
效果图:
4)示例(评分五角星):
<style>
        .rank {
            width: 400px;
            height: 100px;
        }
</style>
<h1>请你打分:</h1>
<div class="rank"></div>
<script>
        //封装的函数
        Object.prototype.addrank = function (n = 0, color = "gray", oncolor = "yellow") {
            this.onmousemove = function (e) {
                var n = Math.ceil((e.pageX - this.offsetLeft) / (this.offsetHeight + 5))
                this.innerHTML=""
                this.addrank(n)
            }

            var canvas = document.createElement("canvas")
            var ctx = canvas.getContext("2d")
            canvas.width = (this.offsetHeight + 5) * 5
            canvas.height = this.offsetHeight
            this.appendChild(canvas)
            for (let i = 0; i < 5; i++) {
                if (i < n) {
                    ctx.drawstar(canvas.height / 2 + canvas.height * i + 5, canvas.height / 2, canvas.height / 2,
                        oncolor)
                } else {
                    ctx.drawstar(canvas.height / 2 + canvas.height * i + 5, canvas.height / 2, canvas.height / 2,
                        color)
                }

            }
        }
        Object.prototype.drawstar = function (x, y, r, color = "yellow") {
            this.beginPath()
            var startAngle = -90
            var deg = Math.PI / 180
            var arr = []
            for (let i = 0; i < 5; i++) {
                var point = {
                    x: x + r * Math.cos((i * 72 + startAngle) * deg),
                    y: y + r * Math.sin((i * 72 + startAngle) * deg)
                }
                arr.push(point)
            }
            //135241 024130五角星的点连线
            this.moveTo(arr[0].x, arr[0].y)
            this.lineTo(arr[2].x, arr[2].y)
            this.lineTo(arr[4].x, arr[4].y)
            this.lineTo(arr[1].x, arr[1].y)
            this.lineTo(arr[3].x, arr[3].y)
            this.lineTo(arr[0].x, arr[0].y)
            this.strokeStyle = color
            this.fillStyle = color
            this.fill()
            this.stroke()
        }
</script>
<script>
        var rankdiv = document.querySelector(".rank")
        rankdiv.addrank()
</script>
效果图:

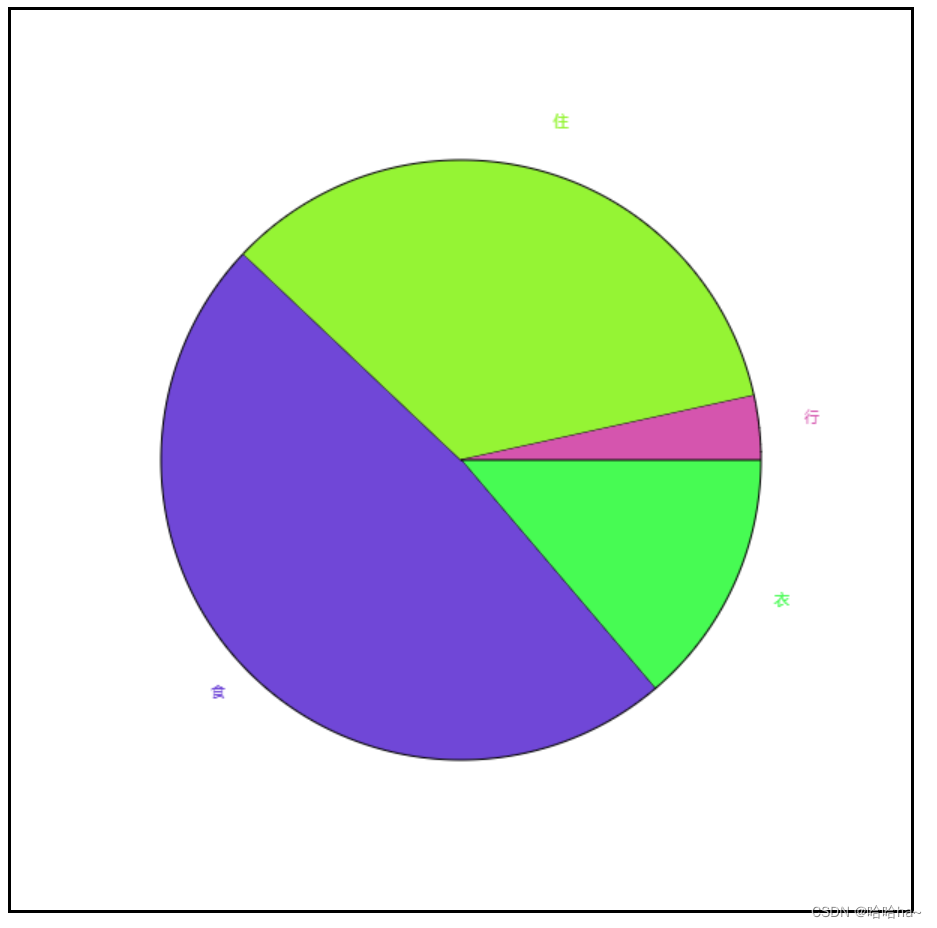
5)示例(饼状图):
<style>
      #box {
            border: 2px black solid;
        }
</style>
<canvas id="box" width="600px" height="600px">画布</canvas>
<script>
        var canvas = document.querySelector("#box")
        var ctx = canvas.getContext("2d")
        var arr=[{name:"衣",money:2000},{name:"食",money:7000},{name:"住",money:5000},{name:"行",money:500}]
        arr.total=0
        for(let i=0;i<arr.length;i++){
            arr.total=arr.total+arr[i].money
        }
        var start=0
        let deg = Math.PI / 180
        arr.forEach(el=>{
            ctx.beginPath()
            var r=parseInt(Math.random()*255)
            var g=parseInt(Math.random()*255)
            var b=parseInt(Math.random()*255)
            ctx.fillStyle =`rgb(${r},${g},${b})`
            var n=(el.money/arr.total)*360
            ctx.arc(300,300,200,start*deg,(start+n)*deg)
            //绘制文本
            let textAng=start+n/2
            var textx=300+(200+30)*Math.cos(textAng*deg)
            var texty=300+(200+30)*Math.sin(textAng*deg)
            ctx.fillText(el.name,textx,texty)
            ctx.lineTo(300,300)
            start=start+n
            ctx.fill()
            ctx.stroke()
        })
</script>
效果图:


 1万+
1万+


 被折叠的 条评论
为什么被折叠?
被折叠的 条评论
为什么被折叠?
 到【灌水乐园】发言


